
|
Task Evaluations |

AE DB Reporting Tool |
Creating Evaluation Reports |

|
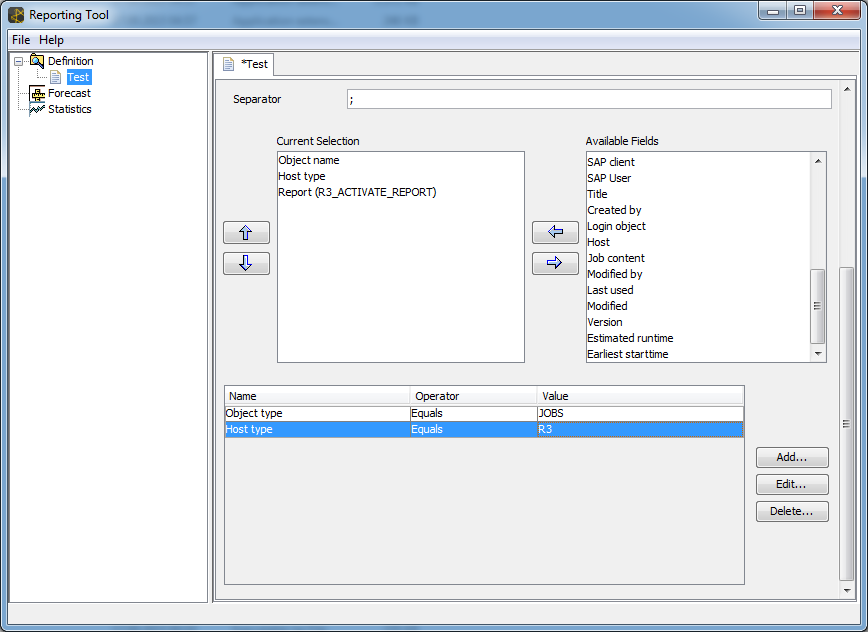
 Graphical Interface of the Reporting Tool
You can define evaluation criteria by using the utility's graphical interface.
This view consists of two halves. The left side shows a tree structure which includes the three areas of evaluation:
Your queries for the evaluation reports are listed below the three main areas.
The right side of the view supplies information about your queries and can be used for the subsequent modification of the corresponding criteria.
Depending on the language settings specified on your computer, the interface is displayed either in German, English or French.
This utility's graphical interface is available on UNIX and Windows.
You can use the following command in order to start the utility (UNIX and Windows):
java -jar ./ucyrepg.jar
Call the required evaluation area by using the menu File -> New query or right-click the corresponding submenu item in the left window half. An assistant opens and guides you through the various specifications that can be made.
 The specified client's time zone is used for evaluations. If it does not include any time-zone specifications, the system uses the time zone of client 0.
 Note that the utility automatically sorts columns if the parameter fixFieldOrder=1 has been specified in the INI file. Specify the object type Job in the filter criteria if the fields that should be shown in the evaluation report occur in jobs. For example: Login object. The utility automatically inserts this filter criterion.
The Finish button stores the specified evaluation criteria. Specifications can be changed subsequently by double-clicking the query. Stored queries are listed in the left window area below the corresponding evaluation area. The right window then shows a list of all forms. Modify the settings if necessary and store your modifications by using the shortcut CTRL-S or the corresponding command in the menu bar.
You can open several queries at a time. The tabs at the upper edge can be used to navigate between the individual form sheets.
The utility stores your queries in the subfolder "queries" in the form of XML files. The file endings depend on the area that has been queried:
By calling the utility in batch mode using the specified evaluation criteria, you can create reports.
The following example shows a query that returns a list of all a client's jobs that use a particular host (WIN01) in the evaluation report.
Call the utility (UCYBDBRT) in batch mode and indicate the created query file as a parameter in order to create the evaluation report.
See also:
Task Evaluations
Creating Evaluation Reports