|
System Overview |

System Overview |
Clients |

|
 Usage
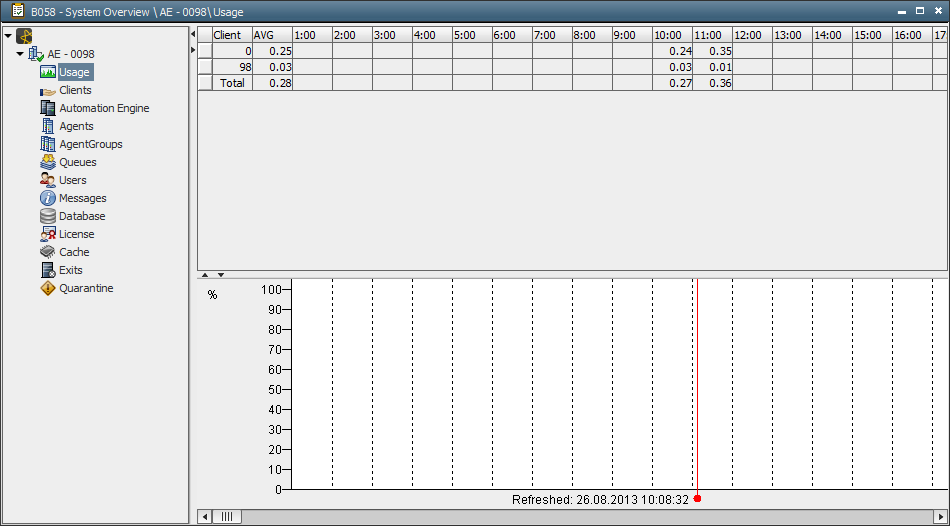
UsageThis category displays the workload of the Automation Engine processes in percent. Values are available for individual clients as well as for the AE system as a whole.
Only clients in which executions take place and a workload actually exists are shown.
The privilege "View server usage of all clients" is required to view the workload of all clients instead of only one's own.
The overview gives information about the workload occurring throughout a day. Reaction to an increasing workload of the AE system is possible by adding server processes. If the workload is high due to the number of logged-on agents and UserInterfaces, the number of communication processes should be increased. If the number of tasks in an AE system is increasing, the number of work processes can be increased.

The overview is split in two halves. The upper half contains a table with columns, each of which stands for one hour. The headings show the respective time. Client data is displayed in lines - one line per client (hourly values and average value). The last line shows the total workload of the AE system.
In the lower half, there is a diagram which shows the total workload in percent. The columns also show the workload of one hour in percent. Directly below the diagram, the current date and time are displayed. The time is additionally highlighted in red.
The values of particular server processes are called up via the popup menu in the category Servers.