|
Gantt Chart |

Gantt Chart |
Chart Toolbar |

|
The Gantt Chart facilitates an easy and structured analysis of tasks in the AE system.
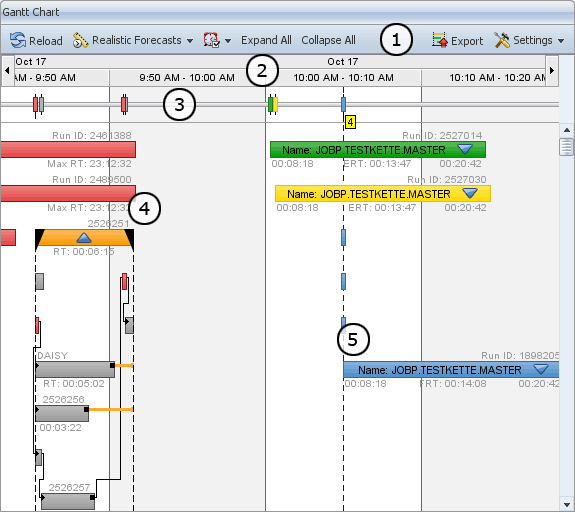
The Gantt Chart is a bar diagram that depicts ended, active and future tasks along a timeline. Different colors are used to highlight types, states and task dependencies. Hierarchic relations (parents and child tasks) are also shown.
You can limit the number of tasks that should be displayed by using a filter so that only tasks are displayed that are of interest for the user.
The following list describes the most important functions of the Gantt Chart window.

(1) Gantt Chart Toolbar
All of the functions that are listed here are described in detail in the document Chart Toolbar.
(2) Timeline:
Because tasks are depicted along the timeline, it is an important component for navigating in the Gantt Chart. Details about this functions are provided in the chapter Navigation - The Timeline.
(3) Timing Bar:
This bar includes flags that indicate the start times of the individual tasks. The main functions of the Timing bar are described in the document Timing Bar.
(4) Task Visualization
This chart displays tasks such as jobs or workflows in the form of bars that reach from the start to the (expected) end time. Texts and colors visualize the properties, states and types of tasks. The functions that serve to visualize tasks are explained in detail in the section Task Bars of the Gantt Chart - Parent Objects and Single Tasks.
(5) ETL Indicator
This line marks the time of the last loading process (Process Analytics Admin - ETL Process).