|
General Introduction |

User Guide |
Process Analytics Studio |

|
The following document includes some cases that are typical for using Process Analytics.
Assume you want to check whether a workflow has successfully been completed and how long processing took.
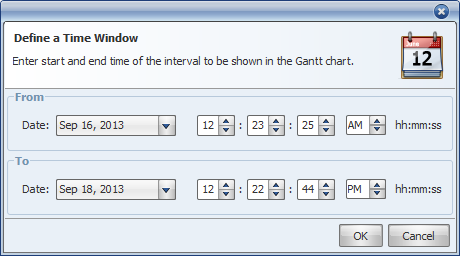
First, we have to locate the workflow. We know already that the workflow has been started on November 5th, at 9:00. The context menu of the Gantt Chart window, we can define a time window.
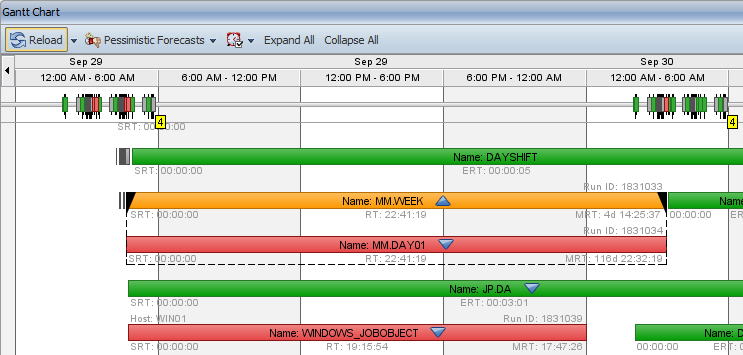
Now the Gantt Chart shows the selected time window. We locate the workflow JOBPLAN1. Due to the fact that the task is shown in dark gray (and not in red), we know that it has been completed successfully.
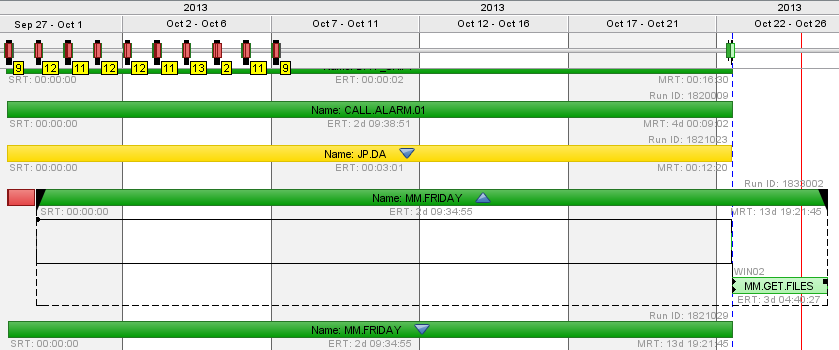
Expanding the workflow (double-click the bar) reveals that the included task JOB2 has started with a delay because of its external dependency to FILETRANSFER2 (RunID: 351). External dependencies display yellow dots at the beginning or end of the task (see screenshot).
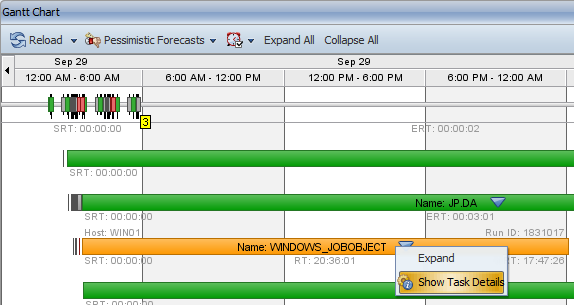
If you select a task in the Gantt Chart, the task including its lines are highlighted in orange.
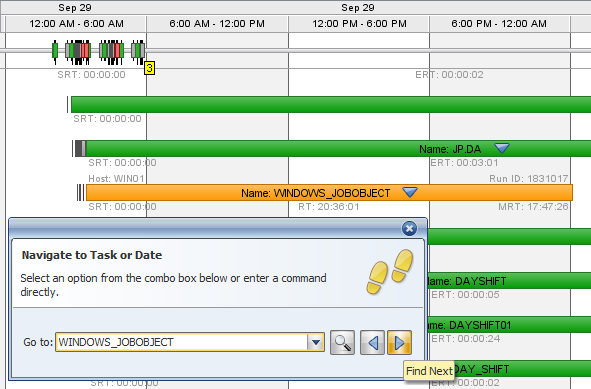
We want to check when an active task will be completed.
First, we locate the ETL indicator. It identifies the time of the last ETL process (last data-loading process) and is shown as a blue dashed line in the Gantt Chart. Active tasks are located in this timeline section.
The Gantt Chart displays active tasks in green. The following screenshot includes three active tasks:
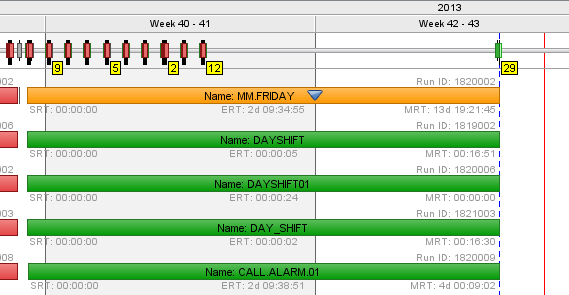
Let's have a closer look at the workflow JOBPLAN4 and the subordinate tasks that it includes. You can expand the workflow in order to have the subordinate tasks displayed: one task has already been completed (JOB40, dark gray), one active task (JOB43, dark green) and three tasks that are about to be processed (light green). The task positions indicate their expected start times.
The end of the workflow and its tasks is based on an ERT (expected runtime) calculation that results from past executions. In this case, the workflow will probably end at 09:04:40.
The following example checks the time at which a scheduled task will start. We also want to know what the task's expected end time is. This point in time is also based on the expected runtime (ERT).
Activate the Realistic Forecasts mode by using the corresponding selection field in the Gantt Chart's toolbar. The forecasted data is now also displayed in the Gantt Chart.
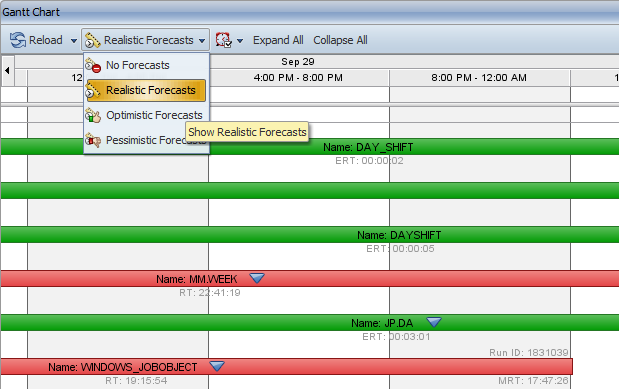
Navigate to the task bar of JOBPLAN3 and expand it. This workflow includes three subordinate tasks (see below). The realistic forecast mode calculates that the workflow will end at 09:05:02.
Now change the forecast mode to Pessimistic Forecasts and the system uses the longest existing runtime for calculating the expected end time. In this case, the workflow's expected end time is 09:06:42.
Realistic forecast mode:
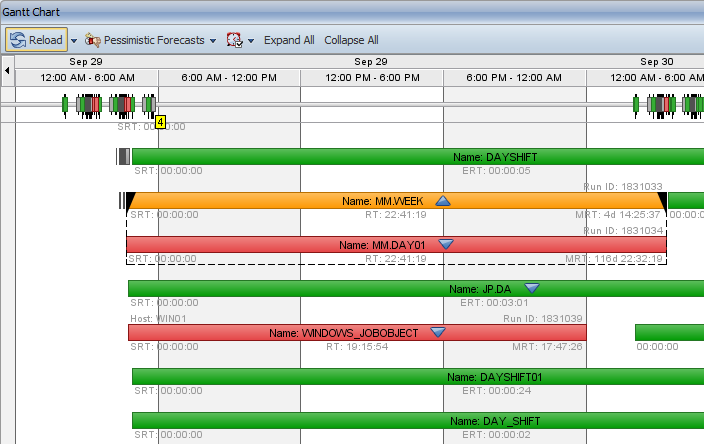
Pessimistic forecast mode:
Let's assume that you want to analyze the regularity and status of a recurrently scheduled task. Use the Go To navigation dialog to locate the task's instances.
You can either use the shortcut CTRL+F or the menu bar -> Navigation -> Go To to open the dialog. Specifying the name of the sample task JOB501 with the prefix "obj:" ensures that only this task name is searched.
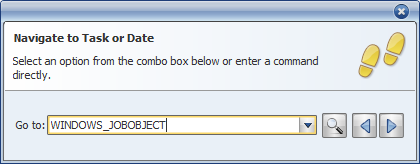
You can use the arrow buttons in the search dialog to switch between the task's individual instances (executions).
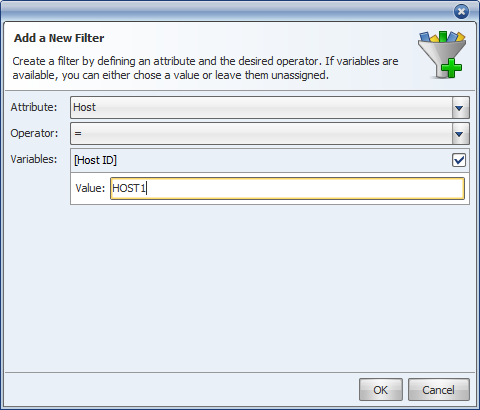
Our aim is to obtain an overview of all canceled tasks that have been started on a particular agent during the past two weeks. In the Filter Management window, we define the corresponding filters and apply them by using the Active Filters window.
Add a new single filter in the Filter Management window which combines tasks with the attribute Host and the value HOST1.
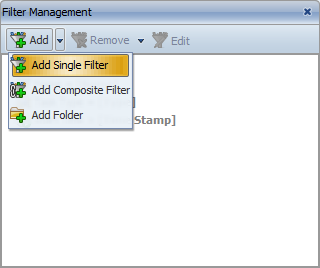
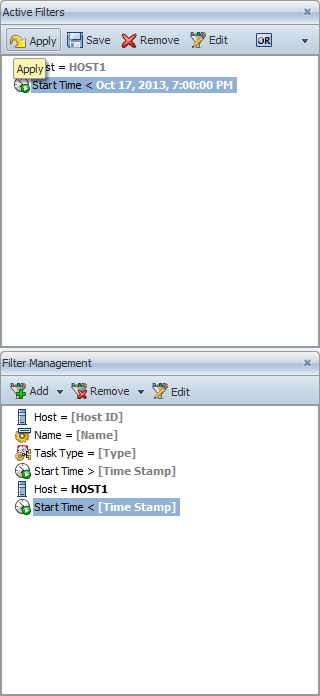
Now add two additional single filters with the following properties:
Status filter: attribute: "Status", operator: '=', value: "ENDED _CANCEL"
Time filter: attribute: "Start Time", operator: "in past [x]", value: '14 days'
Drag and drop these filters to the Active Filters window and confirm them by clicking Apply.
Now we analyze the critical path of a parent object (such as a workflow). A critical path is the longest sequence of tasks in the parent.
AE Process Analytics provides a function that can be used to visualize the critical path and to analyze the chain of tasks that is responsible for a possible delay.
Navigate to the task JOBPLAN100. Use the context menu to open the parent object's detail view. The selected task displays in a separate window.
You can activate the critical path view via the corresponding toolbar button.
Doing so has the effect that the task chain with the longest runtime is displayed in purple.