|
Opening the Detail View |

Detail View |
Filter |

|
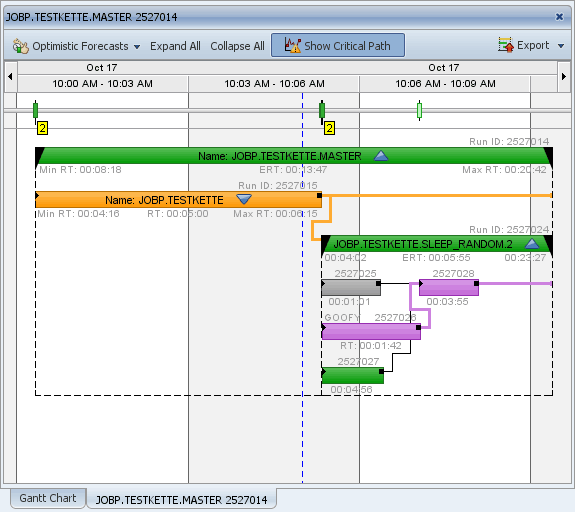
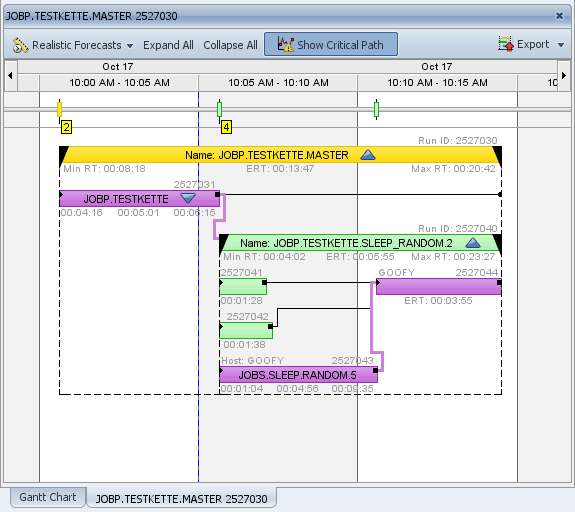
In Process Analytics, you can quickly retrieve the information about the time at which a parent object will finish and the sub-tasks that may cause delays. The critical path displays all this information. A critical path is the longest sequence of tasks in a parent object. Therefore, this sequence complies with the parent object's runtime.
No detail view is available for long running parent objects (such as Schedules) because they are not shown in the Gantt Chart.
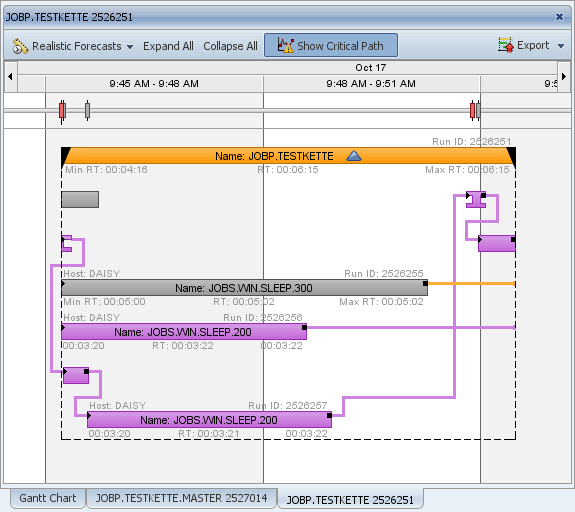
To show the critical path, you can call the corresponding command in the detail window's toolbar. The task chain that represents the critical path is displayed in purple.
A parent object can have several critical paths if several task chains affect the total duration in the same way. This means that a delay in each of these paths increases the parent task's runtime.
For example: A workflow that includes two identical parallel branches.
The critical path of scheduled parent objects depends on the particular active forecast mode and on the expected runtime of the tasks.
You can change the forecast mode in the detail window's toolbar. The selected mode refers only to the particular detail window. It does not affect other windows or views and does not depend on their settings.
The following illustrations explain a forecasted workflow. Realistic Forecasts has been specified in the first example:
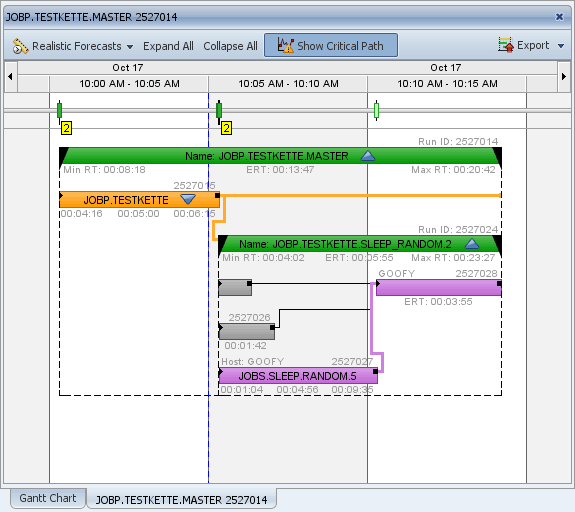
The second illustration shows a detail window including the critical path in the forecast mode Pessimistic Forecasts: