Analytics and Reporting
Analytics is an Automic Web Interface plugin that uses Automic Automation objects in dynamic dashboards to provide a detailed representation of the status quo of your business processes. You access the Analytics dashboards through the home button at the top left corner of your screen. For more information, see Walkthrough of the Dashboards.
Components
Analytics has optional components that can be installed with the Automation Engine. They can be installed on a component by component basis, or in their entirety. Component features are based on the following specialized areas:
-
Analytics and Reporting
Analytics and Reporting is used to collect and compile large amounts of historical data that is related to your Automation Engine system. Data is collected in intervals by the Analytics Backend, and stored in the Analytics datastore. The Analytics Backend retrieves statistical data from the datastore, computes the indicator values to be viewed in dashboards.
-
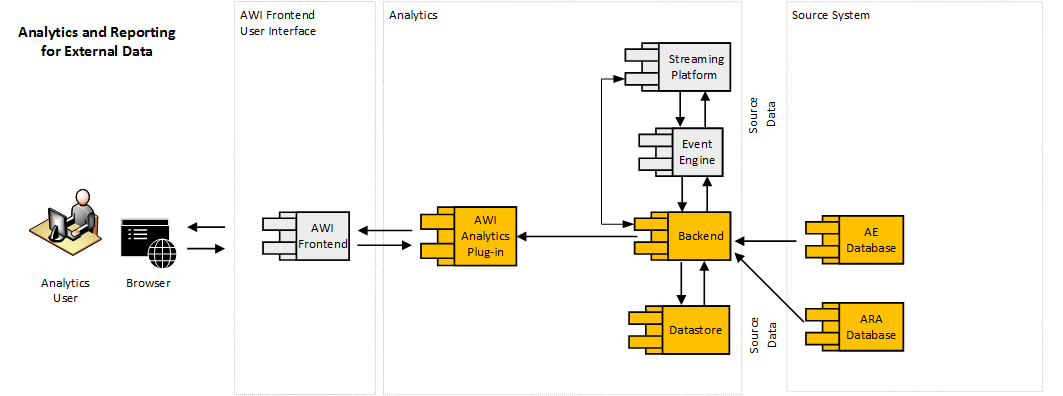
Analytics and Reporting for External Data
External data reporting is based on data that is gathered from external systems. Using a VARA object, you can create powerful reports that help you understand your data better. This documentation provides several use cases to help demonstrate the ease of creating dashboards.
Data is collected in defined intervals by the Analytics Backend and stored in the Analytics datastore. The Analytics Backend retrieves the statistical data from the datastore and computes the indicator values for the dashboards which can be viewed by a registered user via the AWI accessing a configured Analytics client.
To get started with Reporting for External Data, see: VARA to Chart Widget.
This documentation provides many use cases and examples of how to create and configure useful reports on external data. You will find links to those topics at the bottom of this page.
Analytics Component Grid
The following grid shows each optional feature, the component that is required for each feature to work.
|
Feature |
Backend |
Data store |
Streaming Platform |
Rule Engine |
||||||
|---|---|---|---|---|---|---|---|---|---|---|
|
Analytics and Reporting |
Required |
Required |
|
|||||||
|
Analytics and Reporting |
Required | Required |
|
|||||||
High-Level Architecture - Analytics and Reporting
The Add-on Grid
The following add-on grid displays each optional feature and the add-on content that is required to use the feature.
|
Feature |
Analytics Action Pack |
AWI Analytics plug-in | OS Collector | ||||||
|---|---|---|---|---|---|---|---|---|---|
|
Analytics and Reporting |
Required |
Required | |||||||
|
Analytics and Reporting |
Required | ||||||||
Ensure the following action packs are installed. You should see them in the PACKAGES folder in the Explorer sidebar in the Process Assembly perspective.
- PCK.AUTOMIC_ANALYTICS (Analytics Action Pack)
- This action pack lets you create images and PDF documents from dashboards in order to send them via email.
- Launch Analytics datastore maintenance tasks (backup/restore/delete)
Note: If they are not listed in the Explorer sidebar, then you need to download them from our marketplace at https://marketplace.automic.com/ and install them. For instructions about installing an action pack, see Working with Packs and Plug-ins.
See also:
