VARA to Grid Widget
As a chart designer you can use the VARA to Grid widget to measure key business objects. The VARA to Grid widget helps you understand your data better, enabling you to reveal a visual picture of trends across your organization.
Note: If you are using the Automation Engine version 12.3 or below you will be asked to login to view VARA objects, even if you have selected Allow Public Access to this Dashboard.
Notes:
- The VARA to Grid widget replaces the deprecated Cockpit (CPIT) object
- The VARA to Grid widget works with any VARA Object type
Widget Description: Data Source
Data source
- VARA: Select or search for a VARA object data source from the drop-down list. This is the static data source that you base your grid upon.
- Value: Select a Value 1 - 5 using the drop-down list. If you have multiple values in your VARA, this enables you to select a specific Value column. The default Value column is set to Value 1.
- Filter Key: This checkbox enables you to filter contents from the VARA Key column. This is useful when you use multiple keys, and want to create multiple grids based on the same VARA.
Key: The Key operators include: equals, contains, starts with and ends with - Allow Dynamic Filter:
As chart designer the Allow Dynamic Filter option lets you create grid filters that a user can interact with by changing directly in the grid.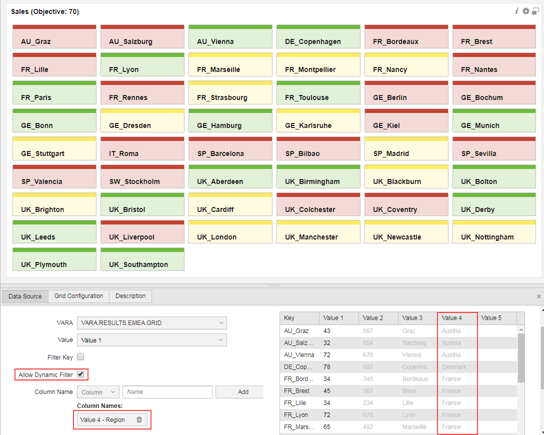
Example: The example above shows an EMEA managers sales objective grid across all EMEA sales regions. The Allow Dynamic Filter is checked and the Value 4 - Region is selected. This view give the manager an overview of who and who is not achieving their sales objective.
Widget Description: Grid Configuration
Grid Configuration
- Title: Enables you to freely enter a grid title
- Columns: You can freely enter a column amount that you need or use the switch
- Show Key: If this checkbox is active the Key column contents is shown on the grid display
Color Mapping
There are two types of color mapping: Numeric and Text.
The following rules apply for numeric entries:
- Value ranges must not overlap
- A color can only be used once (among the mappings of type number)
- The from and to boundary values are inclusive
The text operator that is used, is a case insensitive comparison. The following rules apply for text operator:
- A text can be used only once
- A color can only be used once (among the mappings of type text)
Number mappings are evaluated before text mappings. Example, if you have a VARA value which is 10:
- If you have a number mapping 0 -10 and a text mapping 10, then the number mapping prevails
- If you have no number mapping that matches 10, and a text mapping 10, the text mapping starts
Widget Description: Description
Description
This tab can be used to provide further information to your target audience.