Process Monitoring Widget
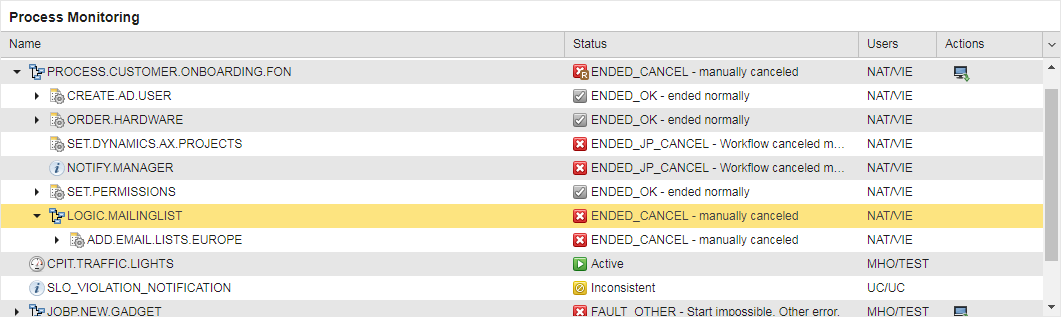
The Process Monitoring Widget provides direct access to the tasks for which you have permissions. It also provides access to all the functions you are entitled to.
Note: This widget can only show active tasks. Deactivated tasks are not displayed.
To Configure the Process Monitoring Widget
By default, the tasks are sorted by RunID in descending order. To change it, click on the caption of the column by which you want to sort the tasks.
The list displays the default columns. Extra ones are available but hidden. To have them displayed, click the arrow button on the list header to expand the list of hidden columns and select the one you need.
To Change the Widget Settings
- Hover your mouse over the widget to enable its toolbar.
-
Click the setting icon to open the Settings pane at the bottom half of the widget.
The widget is expanded to occupy the entire dashboard and allow you to make your changes. When you are done, click the maximize/minimize button on the widget toolbar.
-
The Settings tab is displayed by default.
- The default Title of the widget is Process Monitoring. You can rename it here.
- In View specify how you want to have the list that is displayed, whether as a flat list or a hierarchical (parent-child) list.
- In Refresh Frequency specify the interval at which the contents of the widget are automatically refreshed.
-
Open the Filter tab.
Here you restrict the number of tasks that are displayed on the list filtering them by their parameters. For more information, see Filtering Tasks.
- Click Save and close the pane.
Working with the List of Tasks
Right-click a task to open a context-menu with all the functions you can perform on it. Many functions allow you to select multiple tasks and right-click to perform a particular function in bulk.
The available functions depend on the type of tasks and on your permissions.
More information:
See also: