The Audit History Data Insight
ICE Plan
FYI: The <div> elements defined in this topic for use in ICE are:
- id="ice_insight_audit_history_intro"
- id="ice_insight_audit_history_details"
FYI: This topic in the published doc:
https://docs.automic.com/documentation/webhelp/english/ALL/components/TERMA_DOCU/*.*/AAI%20Guides/Content/Data_Insights/Insights_Type_Audit_History.htm
+++++++++++++++++
HERO
-
Context URL:
/aai/web/v2/insights/*/audithistory
-
ice_insight_audit_history_intro
Understanding the Audit History Data Insight
-
ice_insight_audit_history_details
-
This topic:
https://docs.automic.com/documentation/webhelp/english/ALL/components/TERMA_DOCU/*.*/AAI%20Guides/Content/Data_Insights/Insights_Type_Audit_History.htm
NOTE: For all the other ICE cards, see the code in Using a Data Insight. It should be included for every data insight type.
The Audit History data insight gathers all events that are tracked in the AAI database for each active scheduler. These can be events related to job and jobstream executions, or job or jobstream definitions, or system events.
This data insight can be used for AutoSys schedulers only.
This topic describes the Audit History data insight, what you can use it for, and how to view and use its interactive features.
For general information about how to work with data insights, see Using a Data Insight. For information about creating and maintaining data insights, see Adding, Editing, Copying, and Deleting Data Insights.
This page includes the following:
Purpose
The Audit History data insight is a tool to track what happened when and who did it. You need this kind of tracking in two situations:
-
Triage: When problems arise without an immediately identifiable cause, you can examine past events to get precise details about what happened at or shortly before the problem occurred.
For example, suppose that you start having problems with a job run that started two days ago. Examining the Audit History can reveal that the job definition was updated just before then. Now you can investigate whether those changes are the cause of your current delays.
-
Compliance: Whether it is for company, customer, or governmental compliance, you can have a record to refer to when addressing inquiries about past activities.
For example, you might get a call from your compliance department that they want a list of all jobs that were changed on a particular day to be able to match them to work orders or change tickets that were issued. You can quickly create an Audit History data insight for the changes to job definitions on the requested day and scheduler, and print it, download a CSV, or even attach the output to an email directly to the compliance team.
Benefits
Whereas workload schedulers generally have some sort of audit reporting capabilities, AAI and its Audit History data insight offer the following advantages that are not easily matched by other systems:
-
You can include data from more than one scheduler in one view.
-
The AAI web interface presents the data in an easy to understand structure and format.
-
You can easily manipulate the data with filters, sorts, and the column configuration options on your screen and see the results in real time.
-
Because AAI and its databases are separate from your scheduler server, you can afford to keep many more years of audit history data ready at your fingertips, without compromising the performance of your workload schedulers.
Specific benefits for AutoSys users
In the case of AutoSys specifically, although it has its own audit history capabilities, the problem is that different kinds of events are tracked in three separate archive files, one each for events, machines, and audits. This leaves you having to piece the data together to get a complete picture. AAI brings all those activities into the same Audit History data insight, giving you a complete overview of archive events in one place with no extra effort on your part.
Using filters, you can focus on any number of event types, even if they span different files in the originating AutoSys workload scheduler.
On the Audit History data insight, each change has one line item on the Audit History data insight. This consolidated presentation makes it easier to identify what line items constitute a single change.
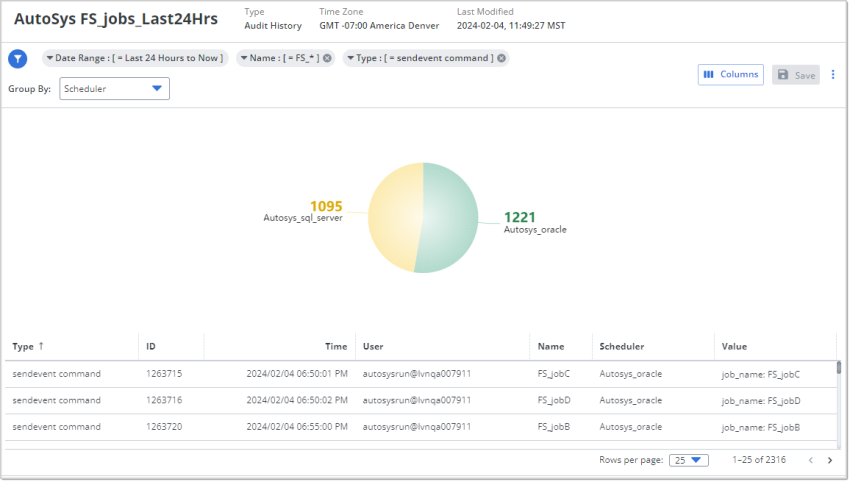
Sample
The following is an example of an Audit History data insight that shows the sendevent command events that were processed for two AutoSys schedulers in the last 24 hours. By clicking one of the segments on the pie chart, you can dynamically filter the table to include only the events of one of those schedulers.
Quick Filtering on the Audit History
You can quick filter the Audit History data insight from the graphic in the following way:
-
Click any segment. It pops out of the whole and the table is filtered to show only the data rows that have the value that the segment represents.
-
Click another segment and it, too, pops out. Now the table filters for both those values. You can continue to click segments consecutively, and each pops out and that value is added to the table filter.
-
To remove a quick filter value, click the corresponding segment. It pops back into the whole, and the value is removed from the table filter.
Notice that the total number of rows at the bottom on the table adjusts as you apply and remove quick filters. After quick filtering to see only the data rows with common key values, you can sort and arrange the table data to surface patterns and outliers.
Group-By Options on the Audit History
With the Group By setting of the Audit History data insight, you can choose what is summarized to make up the slices in the pie chart. Whereas the whole pie chart represents the total of all events that match the filter criteria, each slice shows the proportion of those events that belong to the each value in the Group By column value.
The following are the columns that you can choose for the Group By setting on the Audit History data insight:
-
Scheduler (default)
-
Type
You can define the default Group By option in the Filters settings of the data insight, or you can change it from the Group By field while viewing the data insight.
Best Practice: Schedule Daily Downloads
Because the Audit History is a tool for tracking past events for reconstructing them for audit purposes—as the name indicates—it is good to schedule a CSV file to be produced and emailed to yourself and possibly also the appropriate departments daily.
Tips for success:
-
Audit history data is typically voluminous. Therefore schedule the emails at short and regular intervals so that the attachment does not clog your recipients' inboxes.
-
Use a clearly identifying subject and description, so that your recipients can set up their email program to automatically archive them to a specified folder.
Available Columns on the Audit History
The following are the data columns that are available in an Audit History data insight. You can define filters based on the data in these columns and you can choose to show or hide them in the table. The ones marked with an asterisk (*) are required columns and cannot be hidden. They contain key data or data that is essential to the purpose of an Audit History data insight.
-
Type*: The event type that occurred. The following are the filter options for event types that can be collected for the audit history:
-
Calendar Definition: Any changes related to a calendar definition
-
Connection Profile Definition: Any changes related to the connection profile
-
Job Definition: Any changes related to a job definition
-
Machine Definition: Any changes related to the machine definition
-
Monitor/Browser Definition: Any changes related to monitoring or browser definition
-
Override Definition: Any changes related to a one-time override
-
-
autosys_secure command: Occurrences of this kind of event
-
autotrack command: Occurrences of this kind of event
-
sendevent command: Occurrences of this kind of event
-
-
ID: The internal ID of the event. The sequential ID number tells you precisely the order of events.
-
Time*: The time that the event occurred, in the time zone that is defined for this data insight.
-
User*: The user whose actions triggered the event.
-
Name: The name of the object that was touched, if applicable.
-
Scheduler*: The AAI scheduler name for the workload scheduler on which the event occurred
-
Value: Details about the type of event, such as the full command for a sendEvent or autoTrack command event
You can sort the table on any of the columns except the Value column. This is due to the complexity of the data that the column can contain. To surface events related to a specific action, command type, or other value, add a filter on the Value column that will select them.
Understanding and Using the Audit History Data Insight
While the slices give you a sense or proportional representation of each value, tooltips that appear on mouseover tell you the exact number of data rows that each value appears in.
You can select the data column for which you want to see the subtotal breakdowns. You do this in the Group By field in the upper left of the graphic. You will notice that the Group By offers you only data columns that can provide useful breakdowns of the whole data set.
The pie chart represents all data rows that meet the filter criteria. The slices break down those data rows into aggregates of how often a certain value appears in a selected data column.
While the slices give you a sense or proportional representation of each value, tooltips that appear on mouseover tell you the exact number of data rows that each value appears in.
You can select the data column for which you want to see the subtotal breakdowns. You do this in the Group By field in the upper left of the graphic. You will notice that the Group By offers you only data columns that can provide useful breakdowns of the whole data set.
Use Case