Understanding the Gantt View

The Gantt view offers rich, in-depth details about a single jobstream run in both graphical and tabular formats, that show you the run progress per job as well as tracking of the critical path and against the historical job run averages, and all clearly presented against the SLA defined for the jobstream. Furthermore, the Gantt view provides built-in features that pull in relevant details, such as full job properties and run details, as well as links to the overall jobstream details.

You see the entire process flow from job to job, and you can follow the critical path, explore dependencies, compare the current with their historical average run times, track progress against the SLA deadline, and more. In addition to the interactive Gantt chart visualization, you find job details on a table that you can sort, filter, and sync the Gantt chart with.

This page includes the following:

Overview of the Gantt View

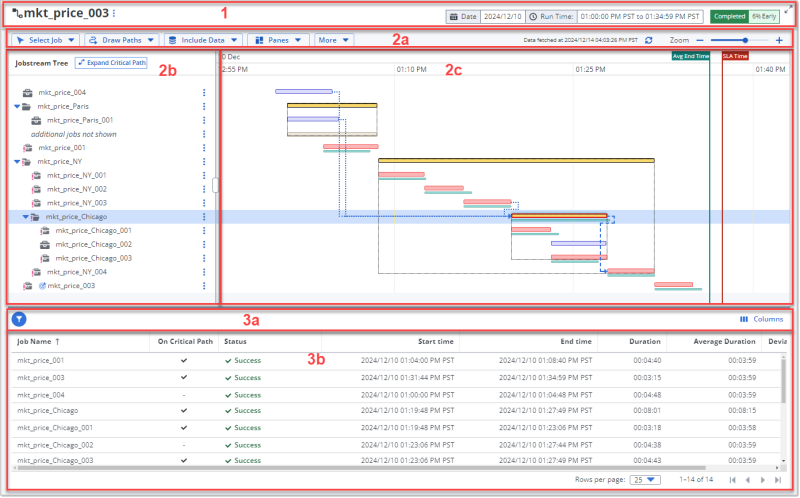
The Gantt View page, which shows the details of one jobstream run, is made up of the several areas:

Overview of the areas on the Gantt chart for a jobstream run

Gantt page contents, see Gantt view, Gantt timeline contents, Gantt page header
  1. The page header, which contains the following (from left to right):

    • The name of the jobstream in large type, which is also the title of the page.

    • An action menu from which you can take one of the following actions:

      • Open Jobstream In New Tab so that you can view all the jobstream detail tabs

      • Edit Jobstream so that you can edit the jobstream definition

    • The date and time picker for runs of this jobstream. You see the date and time of the run that you are currently viewing. For information about how to work with the data and time picker, see .


      Depending on which state the run is in, these could be predicted or forecasted values. For example, a jobstream that is in the running state shows the actual start time and the predicted end time. A future run has a forecasted date and times.

    • The execution state (Completed, Running, or Forecasted) and status (EARLY, ON TIME, or LATE) of the jobstream run that you are viewing.

  2. Gantt timeline contents, Gantt chart description, Gantt timeline description, Gantt chart contents
  3. The Gantt chart, which is made of the following three areas that are in the top part of the page below the page header:

    1. The Gantt chart toolbar contains the menus with options that you use to control what details that you want to include in the visualization of the jobstream run, as well as the options for sharing and exporting the data on the view. For more information, see The Gantt Menus and Their Options .

    2. The Jobstream Tree pane to the left of the timeline. The tree contains the jobs that are part of the jobstream run, based on its definition.

      You can the collapse and expand parent jobs to hide and show child jobs in the process flow. Icons identify the job types, and the items on the list have interactive features that allow you to work with the jobs themselves. For more information, see Understanding the Jobstream Tree in Understanding the Gantt Chart.

    3. The Gantt Timeline pane to the right of the Jobstream Tree. The Gantt timeline is a visualization of the process flow of the job executions that make up the jobstream run.

      What you see on the timeline is affected by the definition of the jobstream, the execution state of the jobstream (completed/running/forecasted), and the selected show/hide options and settings. For more information, see Understanding the Gantt Timeline in Understanding the Gantt Chart

    Note:

    Depending on which of the various view settings are applied to Gantt chart, you see different panes, markings, and even jobs on the Gantt timeline chart. The views settings are controlled by the buttons on the toolbar, as well as from menus. For information, see The Gantt Menus and Their Options and Viewing Job Run Details and Properties in the Gantt View.

  4. The Jobstream Jobs table for the same jobstream run that the Gantt chart depicts. This table is comprised of two areas:

    1. The table toolbar which contains the following controls (from left to right):

      • A filter tool with options that allow you to restrict the table to include only Jobs on the critical path or jobs with Longer than average run times. If you select both filter options, you get all the jobs that are on the critical path as well as any non-critical path jobs that are running longer than average.

      • A Columns menu that you can use to choose which columns are shown or hidden on the table.

    2. The table itself that lists the jobs in the jobstream and provides their key job run statistics. For more information, see Understanding the Jobs Table on the Gantt Page.

Tip:


When you mouseover the border between the Gantt chart panes in the top and the table in the bottom, a double-arrowed splitter icon appears. Click and drag the icon up or down to change how much of the screen area shows the Gantt chart and how much the table.

Navigating the Gantt View

navigate Gantt timeline, navigate Gantt chart, jobstream tree and chart relationship

You can navigate among the jobs in the Gantt View in two ways:

  • Clicking in the Jobstream Tree
  • Using toolbar buttons for specific functions

The Gantt chart with its Jobstream Tree and Gantt timeline include all the jobs in and cover the job execution sequence of even the most complex and enormous jobstreams. Several features are built into the pane to help you navigate the tree and the timeline to locate and focus on job runs that you want to better understand.

Selecting and highlighting jobs

You need to select jobs in the Jobstream tree to be able to see their job details and to use certain functions, such as seeing their critical path or predecessor/successor relationships. There are two ways to select a job:

  • From the Jobstream tree, click anywhere in the row on the Jobstream Tree side, except for the job name.
    The job name is a link that opens its Job Details page. (If you should do that without meaning to, click your browser's back button to return to the Gantt View page.)
  • From the Gantt timeline, click the execution bar of the job run.

When you select a job, the job's row is highlighted with a blue shaded background that runs across the Gantt chart from the Jobstream Tree and through the Gantt timeline. The Jobstream Tree and the Gantt timeline always move in sync. As you select different jobs, the view is positioned to the selected job and that job is highlighted across both panes, so you see the job execution bar that belongs to the selected job in the tree.

expand Gantt timeline, collapse Gantt timeline, expand Gantt chart, collapse Gantt chart, expand container job on Gantt, collapse container job on Gantt, expand child jobs on Gantt, view child jobs on Gantt, hide child jobs on Gantt, show child jobs on Gantt

Expanding and collapsing child jobs

You can expand or collapse container jobs to expose or hide the child jobs as you need. You do this in the Jobstream Tree, by clicking the arrow next to the icon of the higher-level job (the parent job). Click a right arrow to expand a container job and show its next-level child jobs. Click a down arrow to collapse the child jobs. No arrow means there are no child jobs.

When you use the Expand/Collapse Jobs in Critical Path toggle on the toolbar, you expand and collapse only jobs on the critical path.

As always, the Jobstream Tree and the Gantt timeline remain in sync. The jobs they show expand and collapse in unison.

critical path on Gantt, show critical path on Gantt,

Moving along the critical path

If a critical path job is selected (a job with a red icon next to it in the Jobstream Tree), you can use toolbar buttons to go to the next or previous critical path job. For more information, on critical path controls, see The Gantt Menus and Their Options. Critical path jobs have a red exclamation point in their icon on the Jobstream Tree and the execution bar is pink, while the execution bar of critical path container jobs have a red border.

Navigating the timeline

The Gantt Timeline pane has several functions to help you navigate the process flow of the jobstream and focus on jobs that you want to investigate. They are as follows:

  • The Zoom controls on the Gantt chart toolbar to zoom in and out in time to gain a more granular or higher-level view of the execution, as you need.
  • A vertical scroll bar on the right border of the pane. Click and drag this to move up and down the jobstream flow. The Jobstream Tree moves in sync.
  • A horizontal scroll bar on the bottom border of the pane. Click and drag this to move back and forward in the execution time. You see the time on the ruler at the top of the timeline.

Change the size of the panes on the Gantt page

You can modify how wide or high the three panes of the view are.

  • To change how wide the panes with Jobstream Tree and the Gantt Timeline are, mouseover the border between the two panes until you see a horizontal splitter icon, click and drag this left or right.

  • To change how much of the page shows the Gantt chart in the top of the page and how much the Jobs table in the bottom of the page, mouseover the border between the chart and table until you see a vertical splitter icon, click and drag this up or down.

Show or hide the Jobs table

By default only the Gantt chart is shown. You can choose to show the Jobs table or hide it again by selecting or deselecting it from the Panes menu in the toolbar.

See also: