What's New in Version 26: General Enhancements
Automic Automation v26 introduces the following general enhancements:
AWI's Visual Refresh
With this version, the Automic Web Interface interface has received a significant visual refresh; it has now a sleek, modern new face designed to enhance your daily interaction and provide a more cohesive and contemporary user experience.
Refined Color Palette
Automic Automation v26 introduces a modernized visual identity for the Automic Web Interface. This update isn’t just about aesthetics; it is designed to improve daily usability, reduce visual fatigue, and ensure that the platform is accessible to all users. By providing a curated, high-contrast color scheme, the AWI helps you distinguish between environments and task statuses more effectively than ever before.
Enhanced Connection Identification
To help you instantly recognize which environment or Client you are working in (for example, Production vs. Development, the connection color feature has been redesigned. Instead of a subtle thin line, the selected connection color now fills the entire top menu bar.
This screenshot illustrates the new connection color behavior, where blue is used for a production Client and red for Client 0:
(Click to expand)
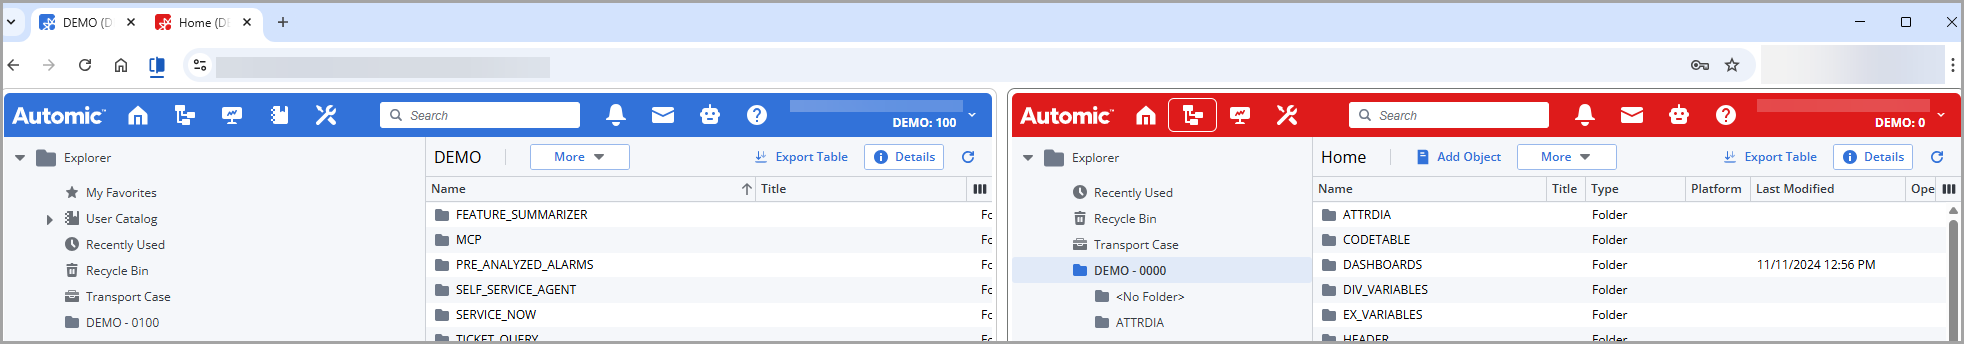
This immediate visual cue helps system administrators and operators easily distinguish between systems, reducing the risk of accidental configuration changes in critical environments.
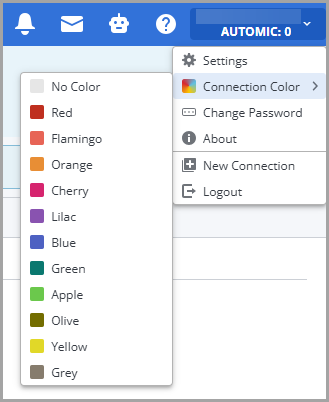
AWI now provides a default set of 25 professionally curated colors. These colors are selected to be visually appealing while strictly complying with accessibility criteria. This ensures that regardless of the color you choose, the text and icons in the header remain crisp and legible.
(Click to expand)
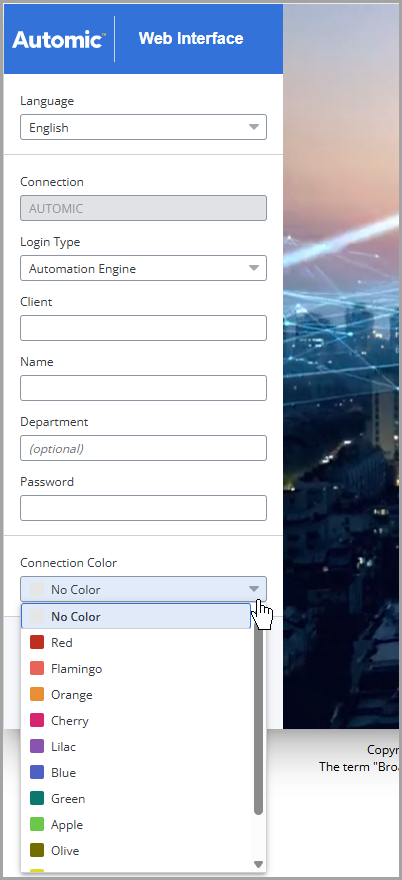
This same set of colors is available for selection when you log in to AWI:
(Click to expand)
Why This Matters
-
Safety
The prominent header color serves as a constant visual "safety check," preventing accidental configuration changes in production environments.
-
Accessibility
Automated color-contrast management eliminates the risk of unreadable UI elements caused by poor custom color choices.
For more information, see Selecting the Connection Color
Crisp, Intuitive Icons
This release introduces a brand-new set of modern, streamlined icons that are designed for instant recognition, improving navigation and giving AWI a truly cutting-edge appearance.
Crucially, while the appearance has evolved, your interaction with AWI remains seamless and familiar. Every button, every menu, and every feature is exactly where you expect it to be. This facelift is purely aesthetic, focused on delivering a more modern, consistent, and visually appealing environment that aligns with the broader Broadcom automation ecosystem.
Important! The new Automic Web Interface requires you to use the following web browser versions:
-
Google Chrome: Minimum 138.0.x.y
-
Microsoft Edge Chromium: Minimum 138.0.x.y
-
Mozilla Firefox: Minimum 140
-
Apple Safari: Minimum 18.5
See also compatibility matrix.
Standardized AWI Theming for Accessibility: Deprecated Theme Color Configuration
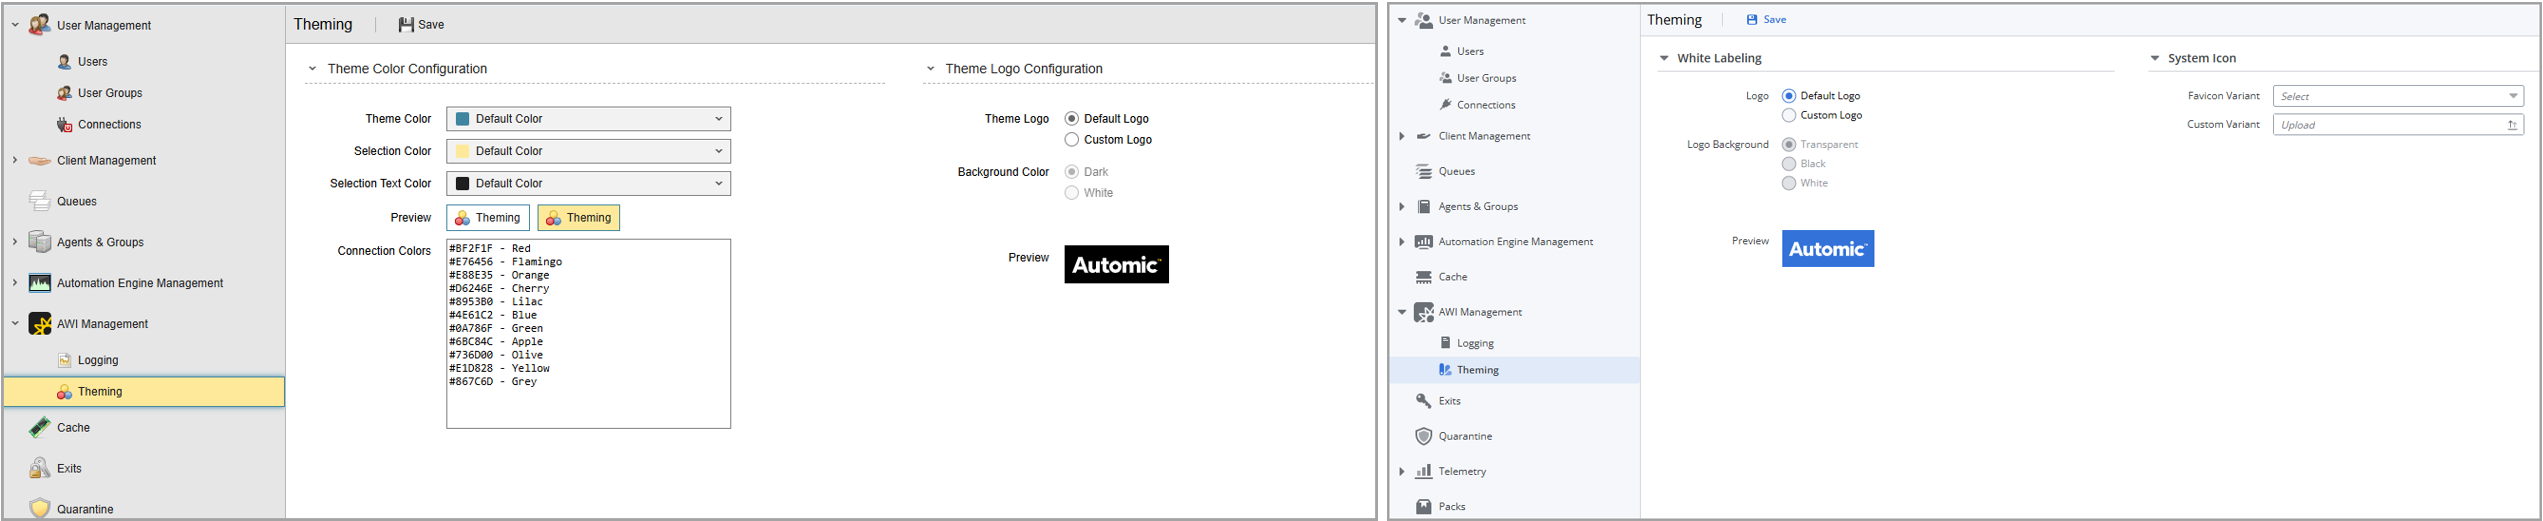
To ensure the Automic Web Interface remains fully accessible and visually consistent, the options for administrators to define free-form custom colors and theme have been deprecated. This includes the ability to select a custom AWI theme (which previously controlled the brand color for selection borders, backgrounds, and text) and the ability to define custom connection colors.
The updated AWI design provides a color palette that adheres to strict accessibility principles. To prevent contrast issues and ensure that UI components remain legible, we have introduced a curated palette of 25 presets. Each preset has been specifically engineered with hardcoded text and icon colors, as well as optimized hover and pressed states.
This change mitigates the risk of unreadable text or inaccessible UI elements, guaranteeing that all environment coloring maintains high usability and meets modern accessibility standards.
AWI Theming Page Before and After
(Click to expand)
Changes to the colors.properties File
Because AWI now natively offers an expanded, fully accessible palette of 25 colors to choose from, defining custom connection colors via the colors.properties file is no longer supported. The colors.properties file is still supplied with the AWI installation package. However, it now only contains two functional parameters: white.background and logo.filename, see colors.properties - Configuring the Logo.
If your organization previously relied on colors.properties to deploy custom environment colors, administrators and users must now select their connection colors directly from the UI presets.
For more information about the AWI theming , see Configuring AWI's Appearance.
New Colors for Task Statuses
As automation environments scale, the ability to "scan" a dashboard for health is critical. To improve visual clarity and accessibility, version 26 introduces a refreshed color palette for task statuses across AWI. This update ensures that you can monitor complex Workflows at a glance and identify critical issues or bottlenecks more quickly. The new palette was chosen with color contrast in mind, making the interface more accessible for users with visual impairments.
The new color mapping is reflected consistently throughout the platform, including the Workflow Monitor (status icons and task box colors), Task list, Dashboards, and Widgets. By providing higher visual distinction between different states, this update helps you check and speed up incident response.
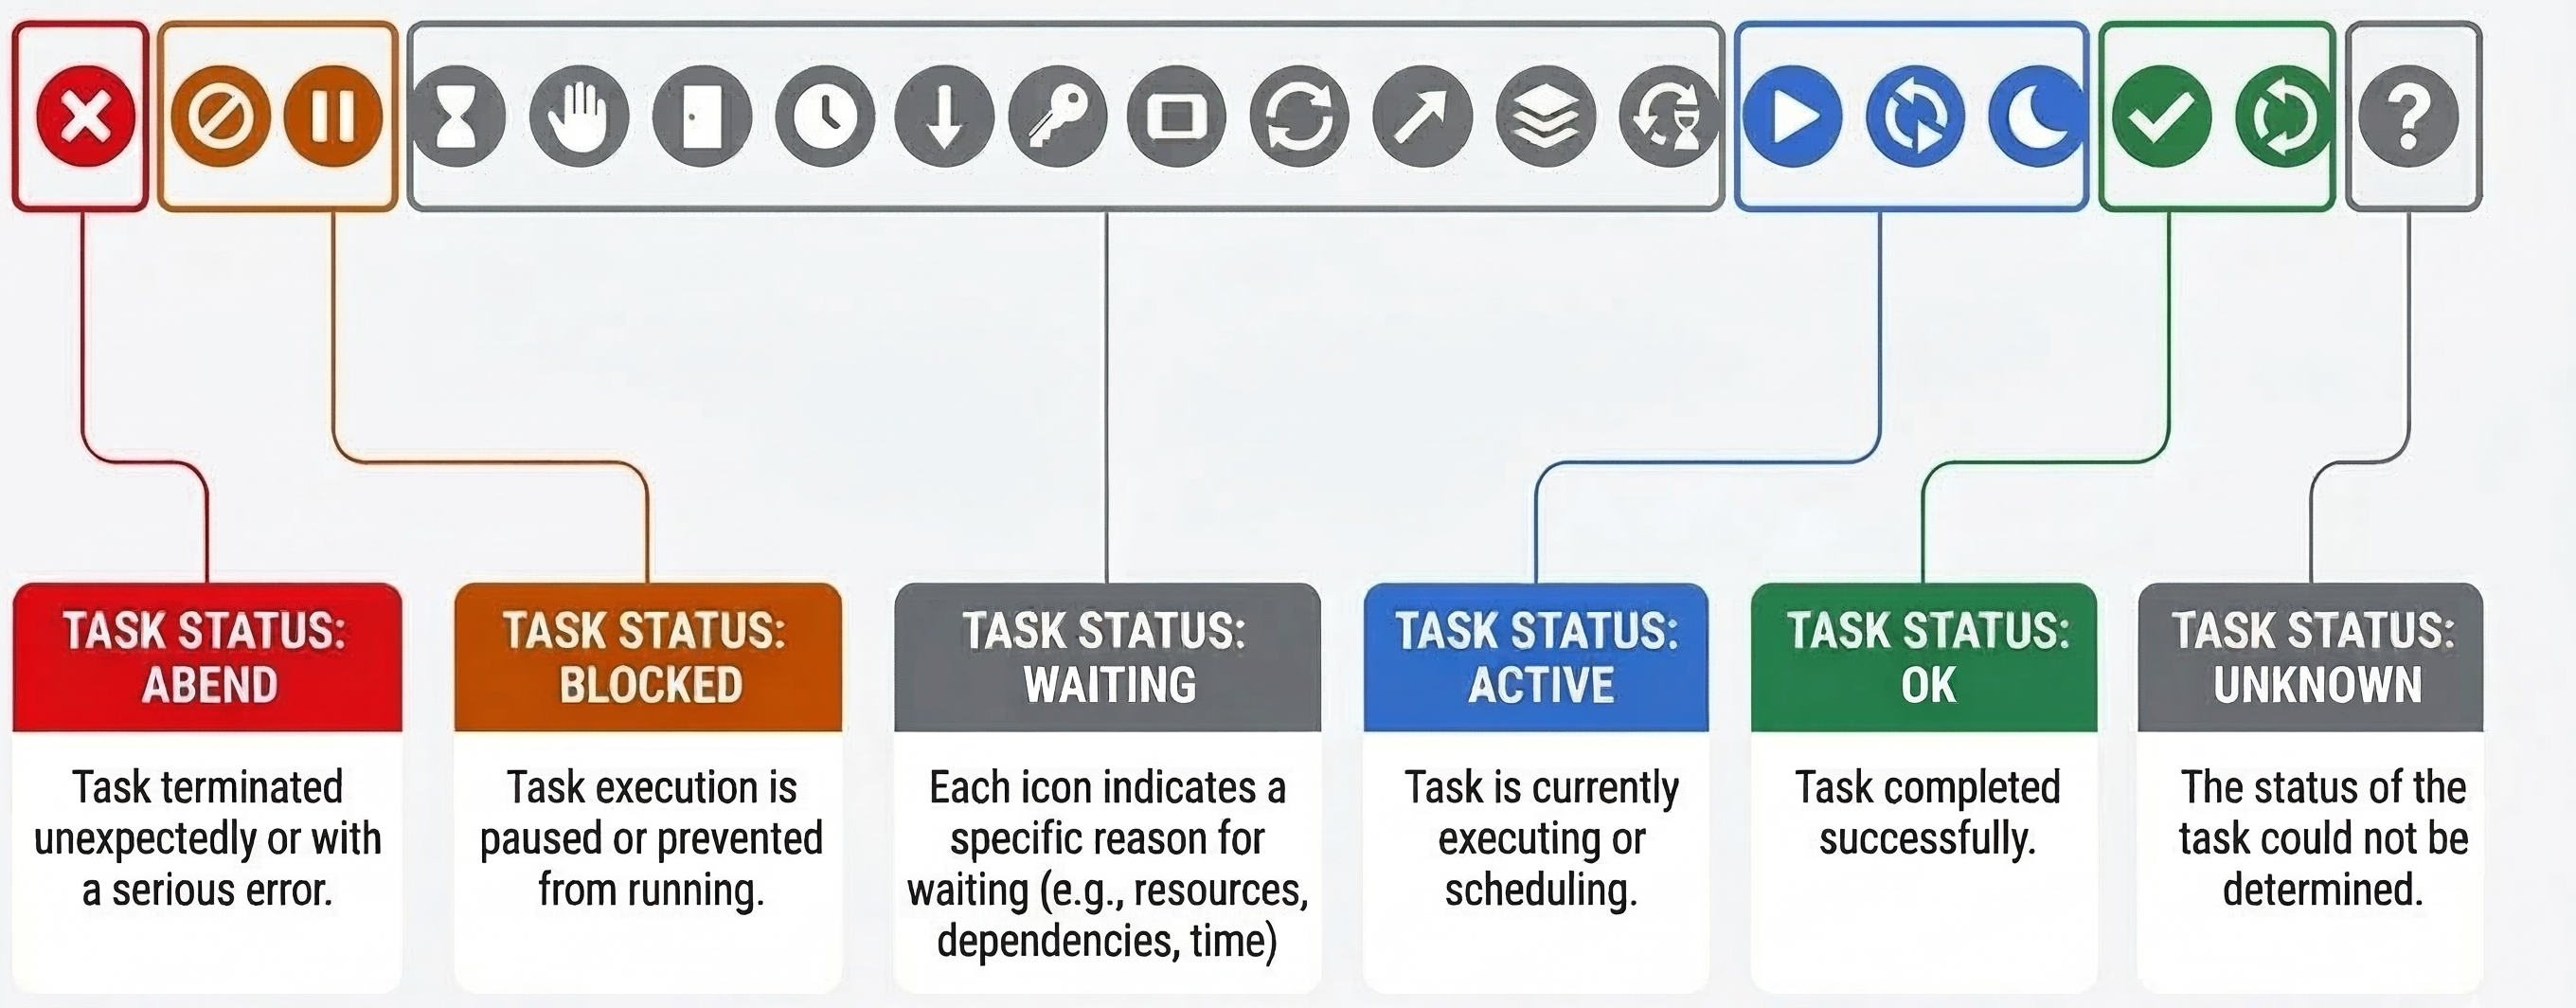
Status Colors and their Meaning
The updated color scheme has been extensively validated with customers and Subject Matter Experts to ensure optimal visibility. The following table and graphic detail the new status mapping:
| Status | Color | Description |
|---|---|---|
| ABEND | Red |
Task terminated unexpectedly or with a serious error. |
| BLOCKED | Amber |
Task execution is paused or prevented from running. |
| WAITING | Grey |
Task is waiting for a specific reason, for example, resources, dependencies, or time. |
| ACTIVE | Blue |
Task is currently executing or being scheduled. |
| OK | Green |
Task completed successfully. |
| UNKNOWN | Grey |
The status of the task could not be determined. |
(Click to expand)
Improvements in the Workflow Editor and Workflow Monitor
To help you manage complex processes more efficiently, version 26 introduces a series of visual enhancements to the Workflow Editor and Monitor. These updates are designed to maximize information density while improving clarity, allowing you to assess your automation logic, monitor task status, and identify bottlenecks at a glance without unnecessary navigation.
The following video highlights some of the most relevant improvements in the Workflow editor/monitor: Watch the Video: Workflow Enhancements in Version 26.
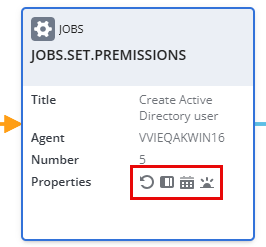
Task Property Icons Now Displayed
Designing complex Workflows often involves fine-tuning multiple task-level properties. Previously, verifying these configurations required a manual "click-and-check" process, navigating through multiple tabs in the Properties pane for every single task.
With version 26, the information about the task configuration displayed in the Workflow Editor/Monitor has been greatly improved, allowing you to assess your Workflow's logic at a glance. As soon as you configure a property for a task and save your changes, a dedicated status icon appears dynamically on the task box. This applies to the most impactful task properties, which now have a visual representative. There are a few exceptions only: When you Variables, PromptSets or Runtime settings, no icon is displayed.
This visual feedback eliminates guesswork, speeds up troubleshooting, and ensures your automation logic is transparent without extra clicks.
The tooltip that opens when you hover over the task box shows all the properties that are set for the task:
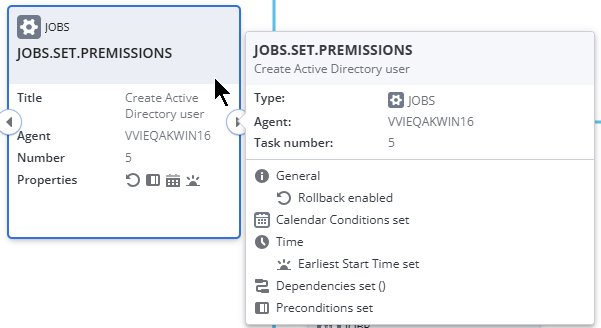
Tip: If you have recently modified a task's properties and the icon does not appear immediately, it might be necessary to refresh the page or the Workflow editor to update the task box display.
For more information, see Task Properties in Workflows.
Improved Behavior when Zooming In and Out
To provide a cleaner, more intuitive experience when managing large processes, we have redesigned the Level of Detail behavior within the Workflow monitor and editor when you zoom in/out.
Based on user feedback regarding interface density, the zoom thresholds have been recalibrated to ensure you maintain a high-level overview without unnecessary clutter. Task containers now transition more logically between simplified shapes and full-detail cards. The "Full Card" view now persists across a wider zoom range, allowing you to see critical task data longer while zooming out.
For more information, see Zooming in the Workflow Editor/Monitor.
Enhanced Filtering in the Workflow Editor
Managing large and complex Workflows is now even easier with expanded filtering options in the Workflow Editor. These additions allow you to navigate and refine your Workflow designs with greater precision.
Building on the existing filters Task Name, Task type, Agent Name, and Conditions, version 26 adds three powerful new criteria:
-
Breakpoint: Quickly identify tasks where execution is set to pause for manual intervention.
-
Calendar: Filter tasks based on assigned Calendar objects to verify scheduling logic at a glance.
-
Task Time: Locate tasks with specific time-based configurations, Earliest Start Time and Time Checkpoints.
By providing a more granular view of your Workflow structure, these tools help reduce configuration errors and speed up the design process.
For more information, see Filtering Tasks in the Workflow Editor.
Enhanced Filtering in the Workflow Monitor
To provide better visibility and control over complex processes, the Workflow Monitor now features significantly expanded filtering capabilities.
In addition to filtering by Task Name, Task Type and Agent Name , version 26 introduces several new criteria to help you pinpoint specific tasks within your Workflows more efficiently:
-
Operational States: Filter by Task Status, Active/Inactive status, and Breakpoints.
-
Logic and Conditions: Narrow down tasks based on Pre- or Post-Conditions, Calendars, and Rollback settings.
-
Execution Details: Search for tasks with specific Comments or based on Task Time (Earliest Start Time and Time Checkpoint).
These enhancements streamline troubleshooting and monitoring, especially in large-scale Workflows with hundreds of tasks.
For more information, see Filtering Tasks in the Workflow Monitor.
Improved Traffic Lights in the Workflow Monitor
Previous versions of Automic Automation featured four traffic lights in the Workflow Monitor that indicated the number of tasks with the following statuses: Abended, blocked, waiting and active.
As of version 26. the traffic lights in the Workflow Monitor feature five statuses:
-
Red for abended
-
Amber for blocked
-
Gray for waiting
-
Bue for active
-
Green for successfully ended

Select a traffic light, the tasks in this status are highlighted.
For more information, see Workflow Monitor Overview.
Enhanced Visibility: New Workflow Progress Bar
The progress bar in the Workflow Monitor provides an at-a-glance insight into the execution status of your processes. The progress bar is now also in the tasks boxes. Each individual task box within the Workflow canvas now features its own progress bar, providing a granular view of that specific task's execution.
This feature improves operational efficiency by allowing system administrators and operators to monitor high-volume workloads more intuitively, reducing the time spent drilling into individual task properties.
Optimizing Space Use in Task Boxes - Workflow Editor
Also, to maximize space within task boxes, time-related labels have been shortened (for example, Estimated Start Time is now Start (EST)), improving readability at various zoom percentages.
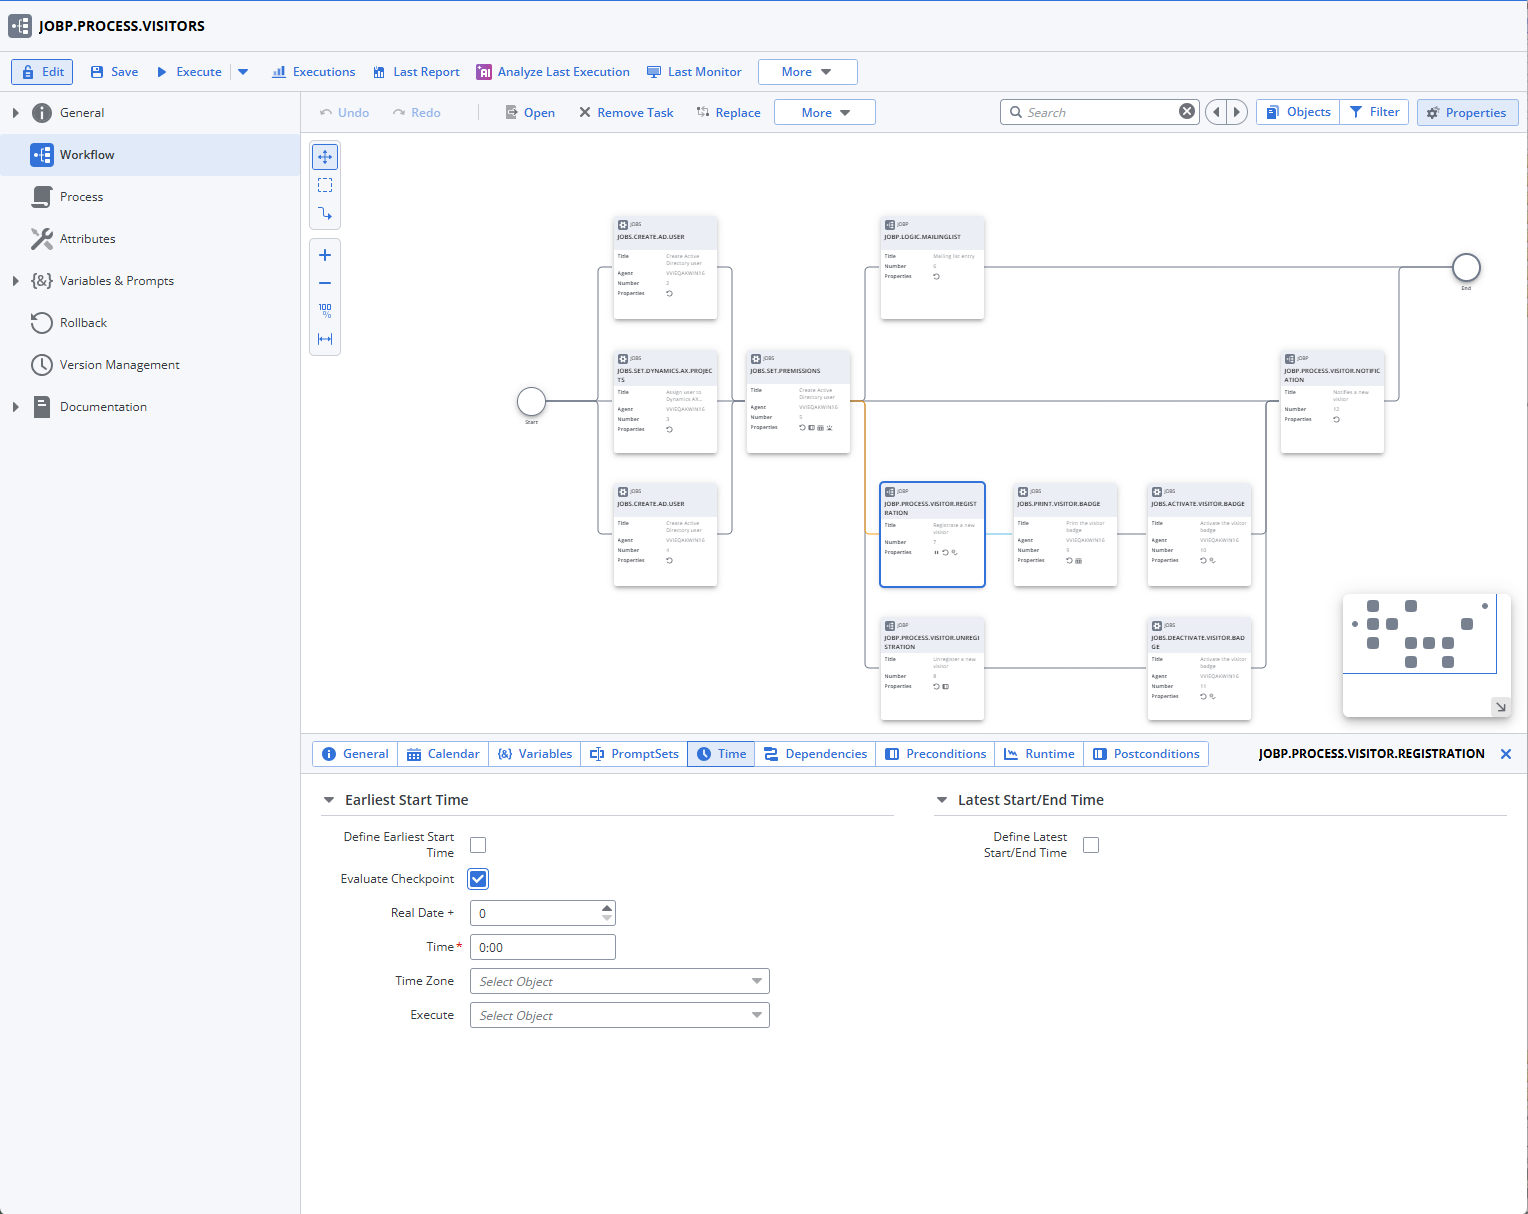
Time & Dependencies Now in Two Separate Tabs
As part of Broadcom's commitment to improve the usability in all our products, this version introduces changes in the Time & Dependencies properties tab in Workflows. This tab contained multiple essential fields for the configuration of task properties. It appeared cluttered and was difficult to understand. This screenshot illustrates what this tab looked like before:
(Click to expand)
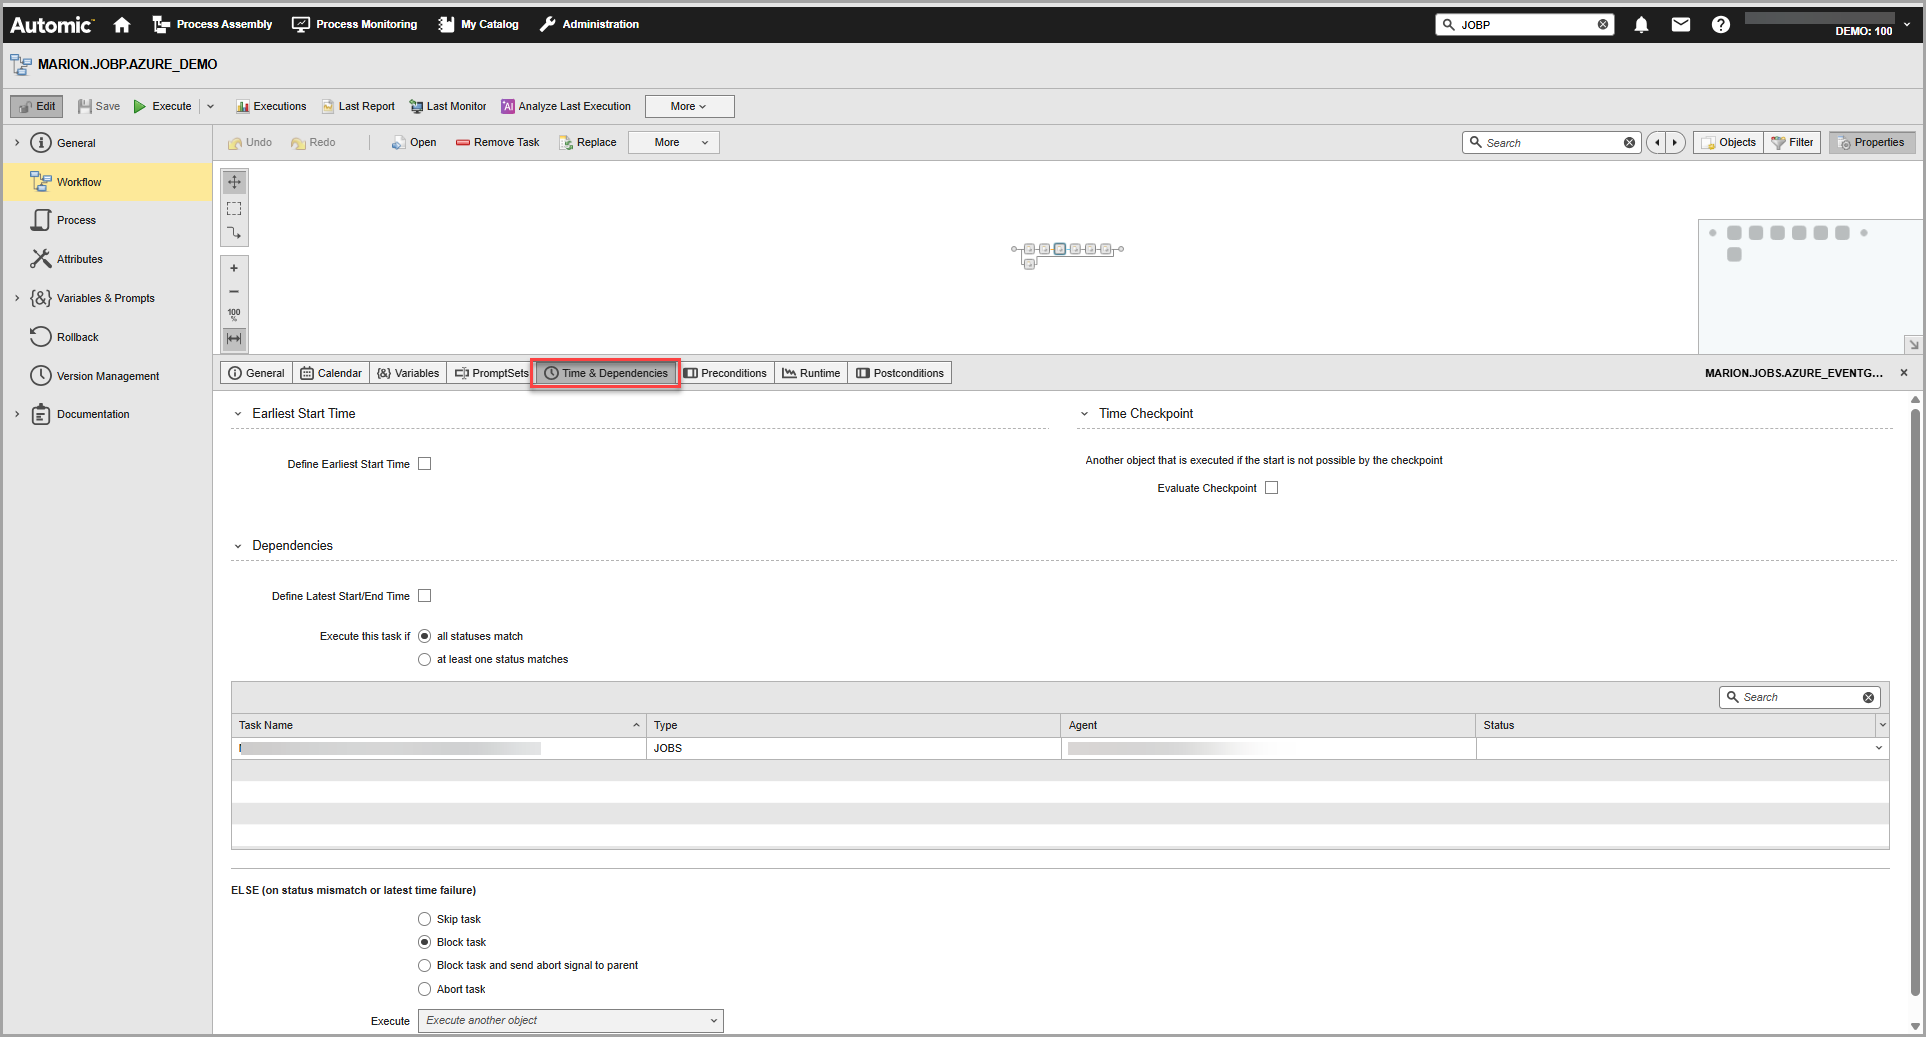
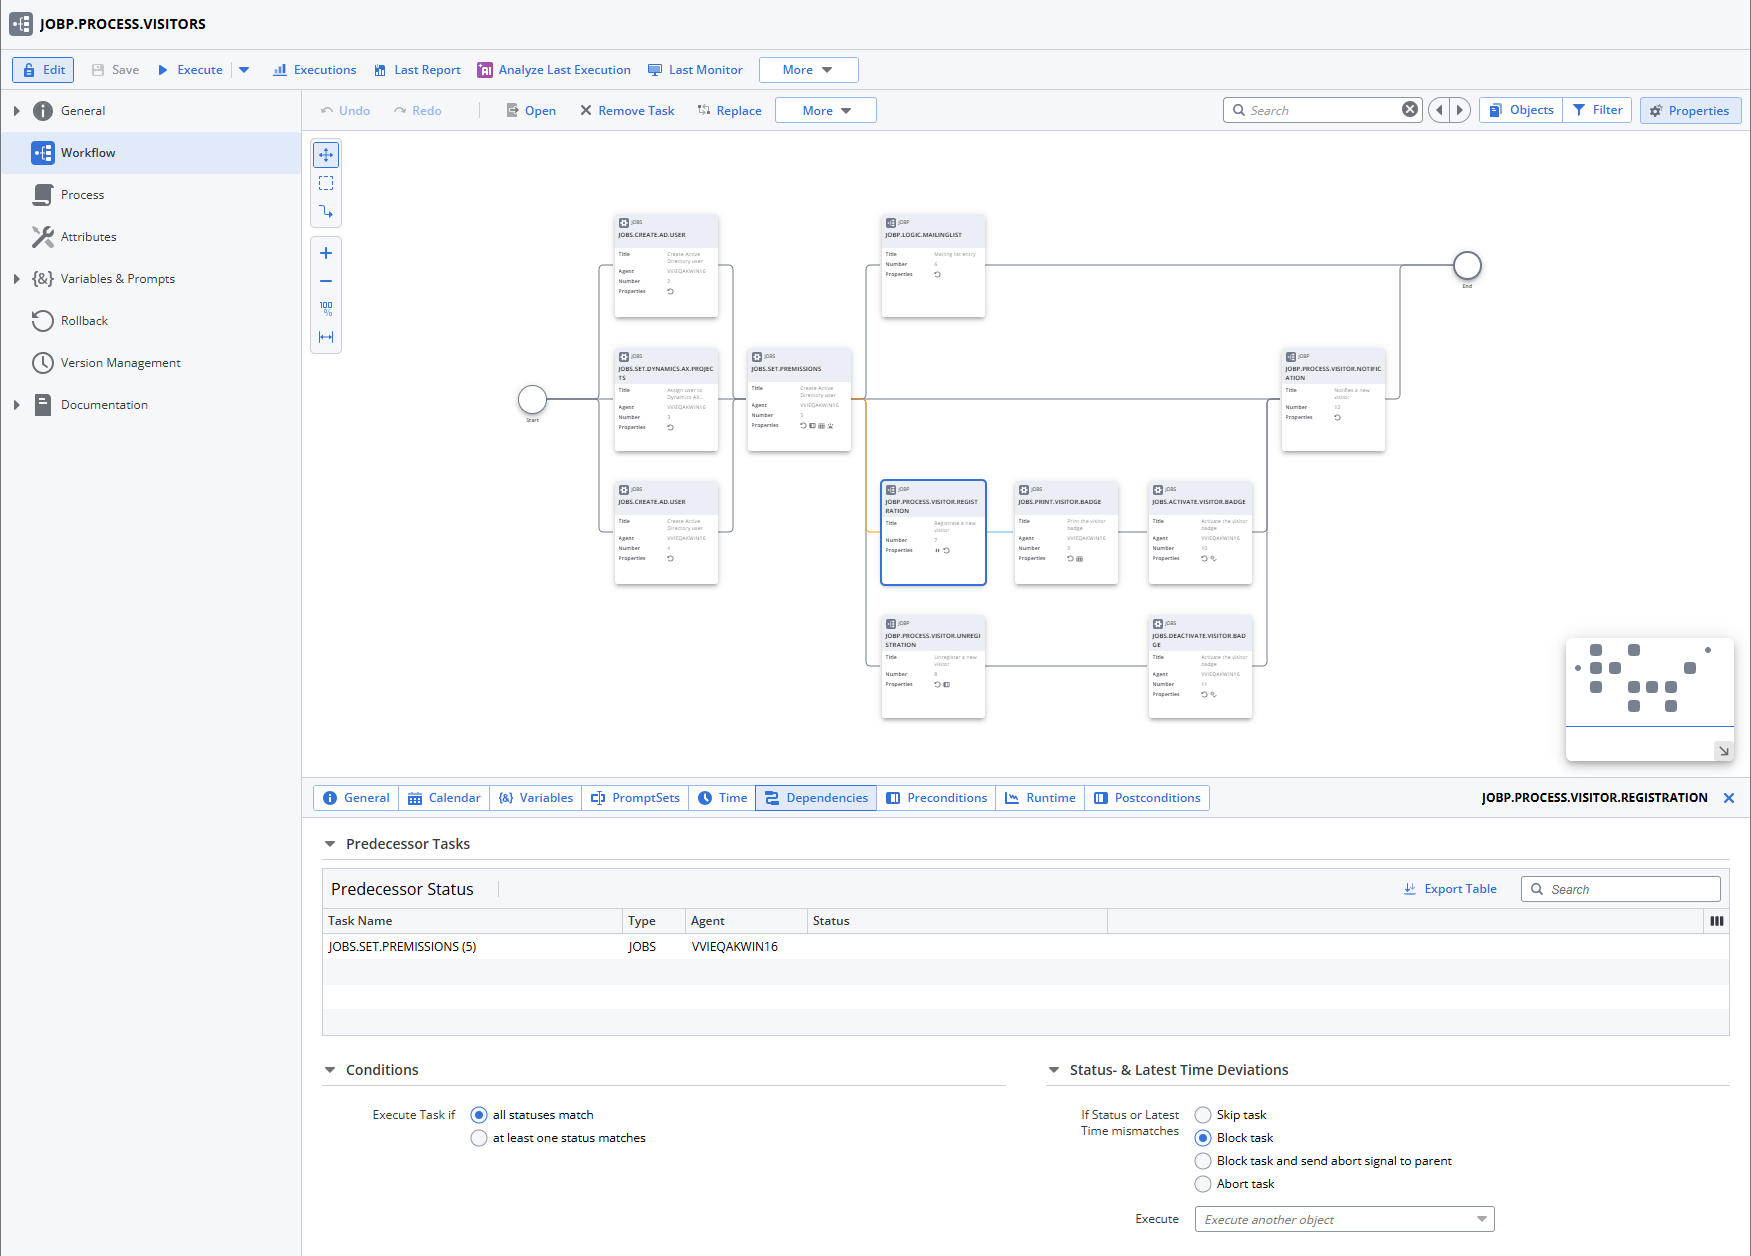
Automic Automation provides these task properties in two separate tabs now: Time and Dependencies. These screenshots illustrate what these tabs look like:
Time Tab
(Click to expand)
Dependencies Tab
(Click to expand)
For more information, see:
Improvements in the Script Editor
Writing and troubleshooting automation scripts is now smoother with updated Script Editor mechanics and new keyboard shortcuts. We have refined how you interact with code by introducing inline script expansion, explicit code completion, and on-demand parameter tooltips.
Previously, parameter tooltips appeared automatically when you moved your cursor over a command, which could obstruct your view of the code. Now, you have full control over when these tooltips appear. Additionally, the ability to expand and collapse included scripts (:INC) directly inline means you no longer need to switch tabs or open separate windows to read nested logic, keeping you focused and saving valuable time during debugging.
New Shortcuts
-
Ctrl + Enter / Cmd + Enter: Expand / Collapse inline include
-
Ctrl + I: Show parameter tooltip
-
Ctrl + Space: Code completion
Important! The parameter tooltip (Ctrl + I) behavior has changed. Previously, this tooltip appeared automatically as your cursor moved across command keywords. It now requires explicit invocation, giving you a cleaner, distraction-free editing experience.
For more information, see Keyboard Shortcuts.
Augmenting the Automic Automation User Experience with the Python Integration
Version 24.5.0, which was available to Automic SaaS customers only, focused on democratizing automation, making it accessible to a wider range of users and skill sets.
This initiative addresses the growing demand for automation and the challenges faced by automation centers of excellence (COEs) in keeping up with business needs. By enabling citizen developers and Python experts, Automic Automation is breaking down barriers and accelerating automation adoption. This initiative is now also available to Automic Automation on-premises.
Automic Automation now includes three new Job types that allow Python developers to seamlessly integrate their code into Automic Automation: Windows Python, Unix Python and Generic Python Jobs. These Jobs let you easily make use of Python extensive libraries by simply specifying them in the Job definition.
For more information, see:
Watch the video on Broadcom Software Academy.
New Report Type for Python Jobs
When executing the new Python Jobs, in addition to the usual Job reports, a new report type called PIP is available. This reports logs the results of installing the Python packages specified in the Job by the Python package manager (PIP). For more information, see Types of Reports.
Python Scripting
Automic Automation enables the integration of Python code, allowing the use of the Python language to address automation challenges. The Python dictionary provided with the offering contains all Automic Automation variables (_automic_variables) available to work with Python jobs, thus allowing you to use Python scripting instead of the AE scripting language.
For more information, see Python Scripting.
Enhancements to Python Integration: Support for Arrays
Version 26 introduces enhanced support for arrays within the Automic Automation / Python integration, streamlining data pipeline implementations. This improvement addresses the limitations of previous versions, where array handling required complex workarounds. The key benefits and features include:
-
Access to Automic Automation arrays as Python arrays: Automic Automation arrays are now accessible as Python arrays within the _automic_variables dictionary.
-
Registration of Python arrays as Automic Automation variables: The automic_register_variable function now supports Python arrays as valid values, in addition to strings.
-
Simplified data pipeline development: These enhancements simplify the implementation of data pipelines by enabling users to directly pass and utilize arrays between Python jobs and other Automic Automation objects.
Example
A Python Job retrieves firewall rules from GCP and stores them in a Python array. This array can now be registered as an Automic Automation array and used in subsequent Jobs or post-processing steps.
firewall_rules = []
firewall_rules = get_firewall_rules(project_id, _automic_job.access_token
if firewall_rules:
print("Firewall Rules:")
automic_register_variable("autrules" + "#", firewall_rules)
Enhanced Log Messages for Immediate Process Identification
To make it easier for you to identify process details at a glance during troubleshooting, we have enhanced the log messages printed immediately after a log rotation.
The existing log rotation message has been expanded for all AE process types (including CP, WP, JWP, JCP, and REST) to include the specific process type, mode, and assigned roles. This enhancement ensures a more intuitive troubleshooting experience by eliminating the need to cross-reference older log files to find how a process was initially assigned.
The enhanced log message now appends these details formatted as follows:
Type: 'WP', Mode: 'PWP', Roles: ' '
Note: Process types that do not use modes or roles, such as REST, will simply display their type.
Enhanced Custom In-Product Help
The process for creating custom in-product help using the Lattice Admin Tool has been updated to give you much more flexibility and control. When designing your help panels, you can now build content using two distinct formats:
-
Sections: Fully editable, free-form text areas used to display custom formatting, embedded media, and guidelines at the top of your help pane.
-
Cards: Structured, action-oriented items featuring an icon, title, and description that expand for more information or link out to external resources.
For more information, see Creating Custom In-Product Help.
See also: