EMI- External Monitoring Interface
The External Monitoring Interface may replace the older SNMP-based monitoring technology. The EMI is based on the JMX technology, providing MBeans for all concerned components of the AE system.
General
The External Monitoring Interface (EMI) is a tool which is used for monitoring the technical status of the AE. The EMI is based on the JMX protocol. JMX is a Java technology that supplies tools for managing and monitoring applications, system objects, devices and service-oriented networks.
The main idea for this JMX based solution is its possible use as a standalone application (monitoring can be done with each JMX based client, for example with Java Mission Control - the free JMX console) or integration into existing monitoring environments, that support JMX (for example HP-OpenView or IBM Tivoli).
Automic strongly recommends using this JMX-based monitoring solution instead of the older SNMP-based monitoring. JMX represents state-of-the-art technology, enabling easy integration with existent monitoring solutions. In addition, JMX has the following advantages upon SNMP:
- JMX is based on a secured network protocol (TCP, instead of UDP)
- JMX can make use of modern security mechanisms (e.g. SSL, Proxy)
- The JMX solution allows interaction with the AE system, thus enabling actions like starting components, etc.
What Is JMX?
JMX: The Java Management Extension, a set of specifications for application and network management in the Java development and application environment.
MBean: JMX facilitates the centralized management of managed objects (called MBeans), which acts as Java wrappers for applications, services, components and devices in a distributed network.
MBean Server: The spine of the JMX architectural frame, allowing server components to plug in and discover all manageable objects.
Details
The EMI solution gathers information from the AE system and makes it available to JMX clients via Java Beans. As the MBeans only represent information from the AE system, these contents (the MBeans) are write protected. The original state and information can only be modified within the AE system.
The EMI utilizes two types of monitoring - active and proactive:
- The active type is used for notifications.
Notification is a JMX-functionality, which enables MBeans to generate notifications, e.g. for signal state changes or detecting problems. - In the so-called proactive type the status of MBeans may proactively be queried, .
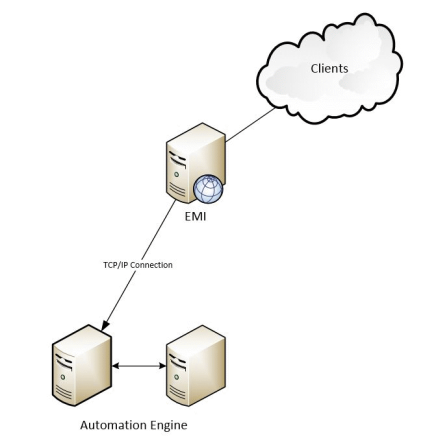
On start, the EMI solution connects to an AE system and logs on to a defined client with a defined user. Once connected, EMI exports certain information from the AE system for monitoring purposes.
Monitoring
A monitoring solution based on EMI allows to monitor selected components of the AE's SystemOverview (for example Usage, Clients, Automation Engine, Queues, Users, etc.) as well as activities and messages (errors and warnings).
Components (MBeans) are grouped with so-called side names, e.g., all Agents are grouped in the side "Agents", all users are grouped in the side "Users".
Controlling MBeans
For each side name an additional so-called controlling MBean exists having the same name as the side. These controlling MBeans are not associated to a side name. They provide general information for the groups, such as the name of the side they are associated with, the number of elements provided in a side or the polling interval used for the side. E.g., the controlling MBean "Agents" (which has no side name itself) provides additional information for all elements grouped by the side name "Agents".
Additional controlling MBeans are dedicated to the status of the EMI itself and the MessageBox (send notifications only), where MessageBox represents the Message Window in the UserInterface of the AE.
This image shows the MBean content displayed in Java Mission Control:

On the left you see the tree of all available MBeans, on the right the attributes, type and description of the selected MBean are shown.
Controlling MBean MessageBox
Messages shown in the message window can be subscribed to with the controlling MBean "MessageBox". In the Java Mission Control Center this can be done by checking the 'Subscribe' check box in the "Notification" tab. Notifications are listed below.

The MessageBox represents the Message Window of the AE system, where system's messages are displayed.
Each Notification is a single message sent from the AE. It is a record containing the time stamp, severity type, the message sequence number, and the message text itself.
The record also contains in the field User Data the raw data of the message: the message sequence number and its so-called insertion texts, whereas the message number identifies the message text in the MSL file and the insertion texts are used for the placeholders in the message text.
The :SEND_MSG command generates messages in the AE, which are broadcast to the MessageBox MBean as Notification. Thus, these messages can be monitored via the EMI as well.
Monitoring Activities
Monitoring of activities optionally can be enabled in the configuration file with the parameter tasks=. If this parameter is set to zero, activities are not monitored. If this parameter is greater than zero, it specifies an interval where tasks are monitored . Only tasks matching the tasks filter criteria are considered. The task filter criteria are provided in the TASKS section in the configuration file. For example, if tasks=20, every 20 seconds the MBeans for each activities matching the filter criteria provided in the TASKS section of the configuration file are updated.
Connection Failover Behavior
When the connection to the AE system is lost, the EMI solution automatically tries to reconnect to the AE system selecting one of the available communication processes.
- When connections to the AE system are established or lost, the EMI MBean is notified and updated.
- Additionally, when the connection to the AE system is lost, all MBeans (except EMI and MessageBox) are removed from the server.
- After a connection has been re-established, the MBeans will be rebuilt automatically.
Requirements
- Java SE version 1.7 or later.
Supplied Files
The EMI solution is delivered with the files you need for installation and configuration.
You will find these files in the directory: IMAGE:MONITORING
MBeans Provided
AgentBean - represents the Agent object on the system
CacheBean - represents the statistics information for a single system cache instance
ClientBean - represents the monitored client ( ![]() With one instance of the EMI one AE client can be monitored at a time)
With one instance of the EMI one AE client can be monitored at a time)
CollectionBean - describes several MBeans registered as one group on the MBeanServer. For example, Users represents a collection of UserBeans.
EMIBean - describes the status of the EMI solution, provides information about the connection and the connection status and displays this information in its Notification tab.
DatabaseBean - represents the DB information used in an AE system. The Mbean instance will have the same name as the DB on the DB system.
LicenceBean - represents the instance of a single license in the System Overview
MQEntryBean - represents a single message queue table used by the AE for message flow. The attributes of this Mbean can be used for the basic KPI of the AE.
QueueBean - represents the Queue object
ServerBean - represents an AE Server instance, equivalent to the Automation Engine entry in the System Overview
WorkloadBean - describes one row in the System Workload Table
UserBean - represents an instance of one user present in the AE system
- Installation of files
- Install Java SE on the host system.
- Unpack the delivered files to a directory of your choice.
- Adjust the relevant parameters in the INI file.
- Starting the EMI Solution
- In order to start the EMI solution, use the following command. In case you stored the INI file in a different location, you can define a path here:
-
java -jar emi.jar [path/to/ini/file/emi.ini]
Testing
- Install the Java JDK
- Start Java Mission Control using jmc.exe, which you find in JDK_HOME\bin\
- Find the EMI solution, …\emi.jar and its process MBean Server.
- In the context menu click Start JMX Console.
- Select the tab MBean Browser, so that you are able to see all the Beans and attributes.
- In the group Automic you will find the AE system monitored and its Beans which are exported by EMI
- Now you can browse and monitor the Beans (data), where each of them will be updated with the next polling interval configured in the INI file.
You can also click on MessageBox and Subscribe for notifications. After that you will receive the System messages automatically, without polling.
See also: