Queue Monitor Widget
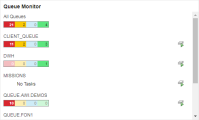
The Queue Monitor widget provides an overview of the status of the tasks per queue of all the queues for which you have permissions.
The color-coded boxes indicate the total number of tasks per status in the queue:
- Red: Aborted or abnormally ended
- Yellow: Blocked
- Blue: Waiting
- Green: Active
The icons on the right indicate the status of the queue, a red square for stopped and a green triangle for active queues.
Configuring the Widget
- Hover your mouse over the widget to enable its toolbar.
-
Click the setting icon to open the Settings pane at the bottom half of the widget.
The widget is expanded to occupy the entire dashboard and allow you to make your changes. When you are done, click the maximize/minimize button on the widget toolbar.
-
The Settings tab is displayed by default.
- The default Title of the widget is Queue Monitor. You can rename it here.
- In Refresh Frequency specify the interval at which the contents of the widget will be automatically refreshed.
- In Filter you can restrict the contents of the widget to specific queues
- Click Save and close the pane.
Setting a Filter
Right-click a queue and select Set Filter to open the Process Monitoring perspective and filter the list of Tasks using the selected queue.
Starting and Stopping a Queue
Right-click a queue and select Stop/Start Queue.
Modifying the Queue
Right-click a queue and select Modify. On the Modify Queue dialog you can change the following parameters:
-
Maximum Slots
Maximum number of tasks that can run in parallel in this Queue. The default value is unlimited. You can enter a value between 1 and 100000.
When an object starts, the Queue slot is reserved before any other objects are checked, such as Sync objects, available resources, maximum number of parallel tasks allowed for a particular objects, agent, etc.
-
Priority
Objects are processed based on their priority. You can enter a value between 1 and 255, the default one being 200.
The priority defined in the Queue object is checked before the priority define in the task. If two tasks have the same Queue priority, the priority specified in the task will be used.
