Analytics and Event Engine
The following new, and improved Analytics features are summarized in this section, refer to the provided links for more in-depth information.
This page includes the following:
Analytics
General Chart Widget Improvements
To improve chart legibility in large data sets, the TopN results can be displayed. In the Configuration section you can now use Only show N categories option and Show Others checkbox.
General VARA to Chart improvements
The VARA to Chart Configuration section has been revamped. Creating a chart is quicker, simpler, and more intuitive. It is now easier to customize your chart labels, add values, create legends, and select colors in one section.
Data mapping is kept when your chart type is changed. See: VARA to Chart Widget
Improved Integration between Analytics charts and AWI
You can now open context menu items Monitor, Report and Object from the table widget.

See Interactive Widget Features: Table Chart Widget
You can now open a DASH object using the Open Dashboard context menu entry from the Process Assembly.
It is now easier to do a quick dashboard search from Dashboards panel and the advanced search.
Extended VARA to Grid widget to all VARA types
It is now possible to create a VARA to Grid using any VARA type. See: VARA to Grid Widget.
New VARA to Chart Filter Key
In the Chart Data source section, you can now filter on a VARA key to reduce the data set.
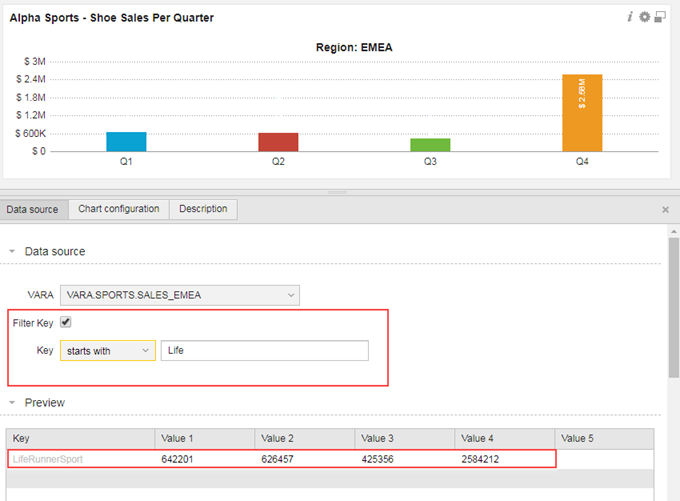
See Filter Key: VARA to Chart Widget
New VARA to Chart and VARA to Grid Dynamic Filter
A Dynamic Filter key check box is now available in the Data source section. The Dynamic Filter lets a dashboard designer prepare interactive dashboards for business users. With dynamic filters, a user is able to switch their dashboard view.

See: Creating VARA to Charts Using Dynamic Filters and Creating A VARA to Grid Using Dynamic Filters
New separate timeframe feature for Analytics widgets
It is now possible to have a separate timeframe for an individual Analytics widget. This makes it easier for you to compare data over different timeframes within a dashboard.
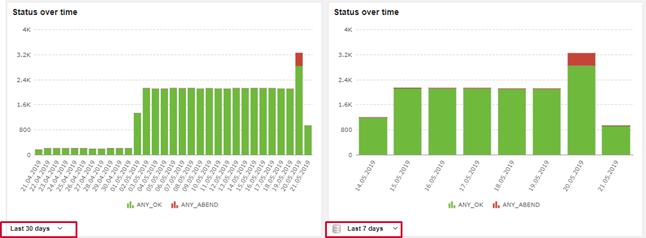
See Setting Specific Widget Timeframe: Table Chart Widget
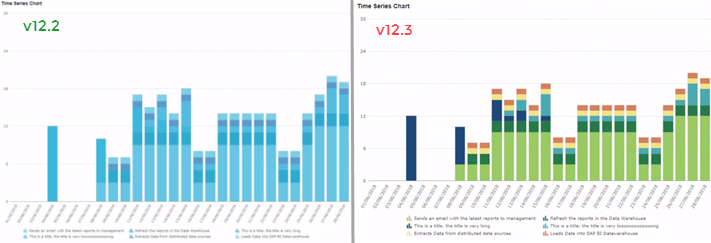
Modern color palette for Analytics widgets
To improve chart and grid readability the color palette has been updated. The new palette offers a variety of vibrant modern colors to add to your charts and grids.
Updated Analytics Action Pack that features a Datastore Optimization Action
A new optimization action is now available. The data optimization action enables you to reclaim storage occupied by dead tuples. See: Datastore Optimization
New Analytics Action Pack that features a Database Shrink Action
The Analytics action pack now offers a new option to shrink the Datastore

New cache configuration service for better database performance
The Analytics cache can speed-up repetitive database queries by keeping results in memory until a configured expiration time is reached.
See Configuring the Analytics Cache at Installing Analytics and the Event Engine
Event Engine
New JSONPath Builder that makes mapping data to Event Definitions easier
It is now easy to copy and paste a JSONPath sample into the editor. You can manually enter an expression, and evaluate it using the Expression box.
Filter your received data by selecting a line in the editor, and click the Create Expression button to auto-generated an expression and result.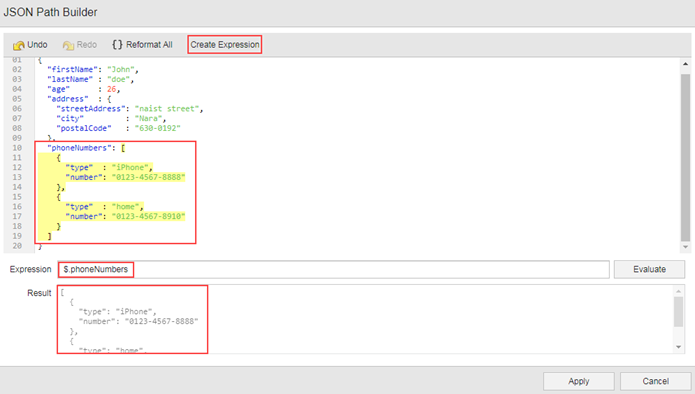
See: Integrating Webhook Events from External Systems
Custom Rule framework for Java developers
The Custom Rule feature lets you to create your own Event Engine rules by directly accessing the Apache Flink rule engine API.
The framework lets you design and build your own rules, gives you control and flexibility to implement your own functionality on received events.