Troubleshooting Event Engine Components
As an Automation Engine administrator it is possible that you will encounter problems with some Event Engine components.
Important!You should have good experience working with the Apache Kafka and Apache Flink
Issues that you may encounter
- You execute an Event Engine rule, but its REST endpoint returns an invalid key error
- You send trigger events to the REST Endpoint but the event counter does not increment
Troubleshooting Steps
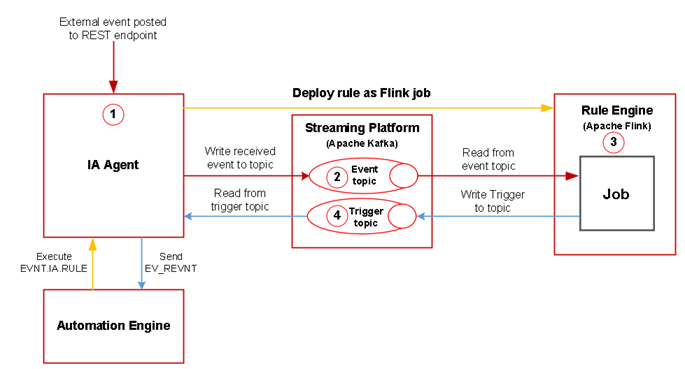
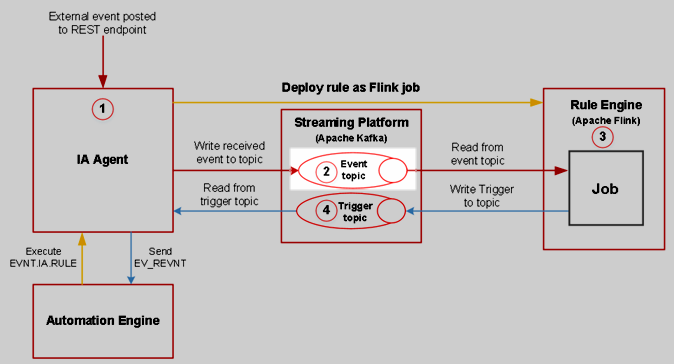
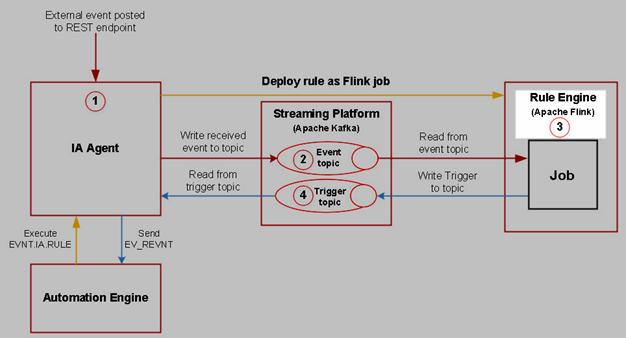
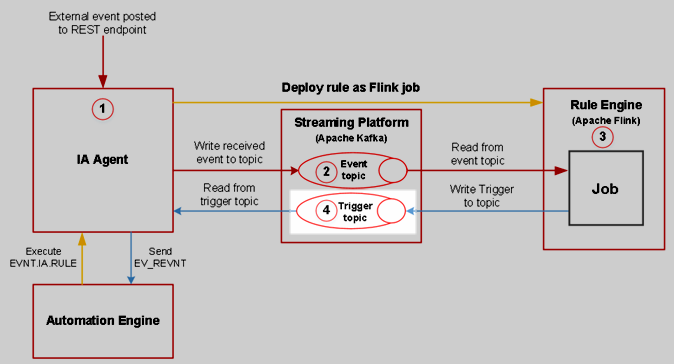
Before you start to troubleshoot, you should familiarize yourself with the event route in the Event Engine. The following figure shows the message flows between the Event Engine components, the numbers indicate the sequential steps.
Step 1 - Test the REST endpoint of your RULE
To test the REST endpoint the Analytics Backend should be running. Use the Service Manager to verify the Backend status, the service is called ANALYTICS-BACKEND. A green check indicates that the Analytics Backend is running:

Important! Restart you Analytics Backend if it is not running. If after the restart the service fails, then check the Analytics Backend log file located in the following directory:
<Automic>\Automation.Platform\Analytics\backend\temp\analytics_backend.log
To enable the REST endpoint set the collector.events.enabled property to true. The value can be changed from the application.properties file located in the following directory.
<Automic>\Automation.Platform\Analytics\backend\application.properties
Example:
#####################
## Events ingestion #
#####################
# Enable/disable event ingestion
collector.events.enabled=true
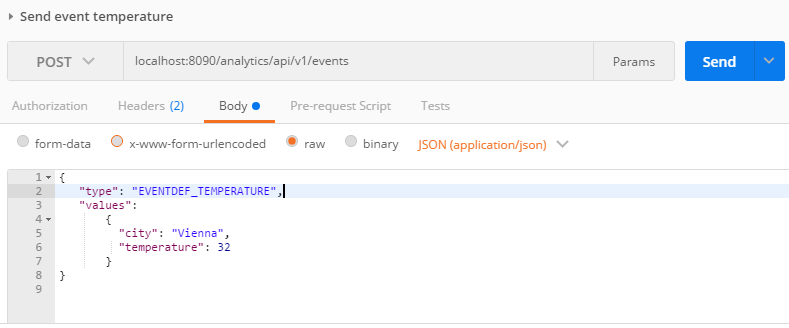
To test the REST endpoint send a POST request using Postman or cURL. The HTTP status response code should be 200 OK.
Testing the REST endpoint with Postman
Set up the following data in Postman:
Request method:
POST
REST Endpoint:
<backend.endpoint>:<server.port>/analytics/api/v1/events
Headers:
Content-Type: application/json
Authorization: <your scoped api-key>
Body:
{
"type": "EVENTDEF_TEMPERATURE",
"values":
{
"city": "Vienna",
"temperature": 32
}
}
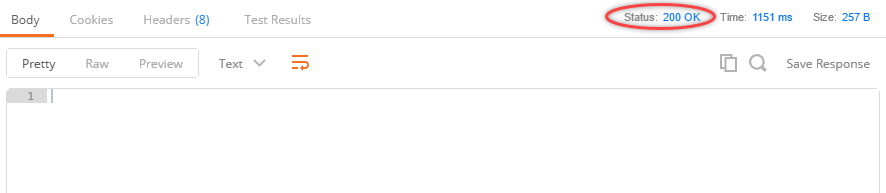
If you get the response code 200 OK in Postman, then the REST endpoint is working correctly.
Testing the REST endpoint with cURL
curl -X POST \
http://<backend.endpoint>:<server.port>/analytics/api/v1/events \
-w "\nStatus: %{http_code}\n" \
-H 'Authorization: <your scoped api-key>' \
-H 'Content-Type: application/json' \
-H 'Cache-Control: no-cache' \
-d '{
"type": "EVENTDEF_TEMPERATURE",
"values":
{
"city": "Vienna",
"temperature": 32
}
}
'
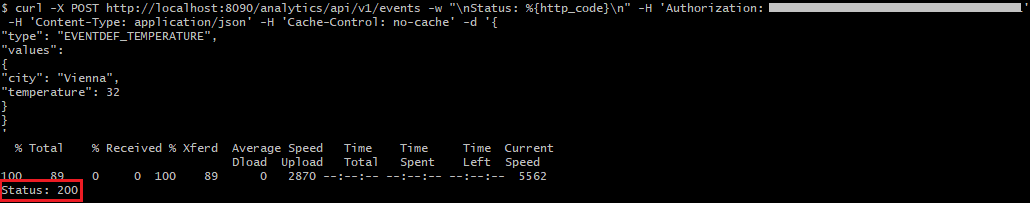
If your output status code is 200, the REST endpoint is working correctly.
Important! The /events endpoint will return status code 200 even if the Event Definition in the JSON payload does not exist on the targeted client (therefore no rule is triggered). To ensure that the Event Definition exists on the target client, use the object search.
Notes:
-
To invoke cURL easier save the request body in a JSON file (example, event.json). Example:
curl -X POST -w "\nStatus: %{http_code}\n" --header "Content-Type: application/json" --header "Accept: application/json" --header "Authorization: <your scoped api-key>" -d @event.json "localhost:8090/analytics/api/v1/events"
- By using the -w switch you can force cURL to output the HTTP request status code.
Step 2 - Check if Event Engine components are compatible with each other
The quickest way to see your installed component versions is to go to the AWI click on the client menu (located on the right of the main tool bar) and select About. A list of all your installed components with their version will be displayed.
To check each component compatibility, use the Compatibility Matrix
Step 3 - Verify if the Client you use for a Rule is the same as the Client you specified by creating a scoped API key
To verify the Client used for a Rule is the same as the Client specified in a scoped key, you should do the following.
-
Open the application.properties file using an editor. This file is located in the following location:
<AUTOMIC>/Automation.Platform/Analytics/backend/
In the Log Configuration section, set the Application logging level to TRACE.
Example:
#######################
## Log configuration ##
#######################
#Base directory where all backend logs will be stored
logging.basedir=temp
#Application logging level
#Possible values: TRACE, DEBUG, INFO, WARN, ERROR, FATAL, OFF
logging.level.root=TRACE
logging.level.org.apache.kafka=TRACE
-
The Client ID is the generated analytics_backend.log. The log file is in the following location:
<AUTOMIC>/Automation.Platform/Analytics/backend/temp/
You can find the Client ID in the API key validation output if you search for "is valid for clients" text in the trace file. In the customer's trace file I have found: "API key '<customer API-key>' is valid for clients [102]" - it means the scoped API key is generated for Client 102.
Step 4 - Verify that your events have been written into the Kafka event topic
If your RULE or WEBHOOK object HTTP API responds with a status code 200, and your Rules do not trigger, check the event topics in Kafka.
Kafka is a distributed message broker that is responsible for transporting events for Rule processing in Flink, and sending triggers for actions back to the Automation Engine. Kafka comes with a set of command-line tools that allow you to view configuration and internal structures, these tools are located:
-
Linux
<AUTOMIC>/External.Resources/kafka/kafka_2.11-0.10.2.1/bin
List all topics on Kafka
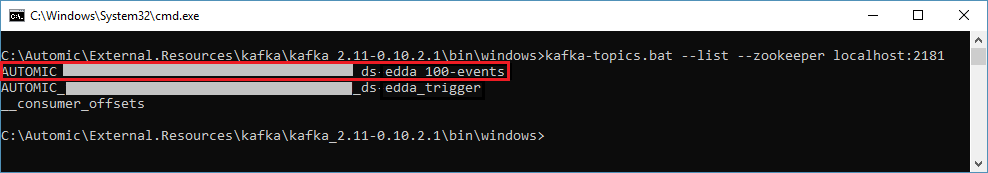
Next verify that the topics required for event processing are present in Kafka. This is done using the kafka-topics tool:
kafka-topics --zookeeper <host>:<port> --list
Note:A Zookeeper connection string is required in the form host:port. The default Zookeeper port is 2181.
The --list command provides a list of client specific inbound topics that are managed by Kafka. The output list should match the following patten:
AUTOMIC_<hash value>_ds-edda_<CLIENTID>-events
Attach a console consumer to the inbound topic you want to listen
The next stage is to verify that the inbound Kafka topic receives your events.
Attach a console consumer to the client-specific topic you identified in the previous step:
kafka-console-consumer --zookeeper <zookeeper host>:<zookeeper port> --topic AUTOMIC_..._ds-edda<CLIENTID>-events
Send an event to the /events REST Endpoint
To verify the event transport, send an event using the REST API. You can do this using a graphical REST client like Postman or a CLI-based tool like cURL.
Send an event using cURL
First save the event body in a file, for example event.json. After execute the following cURL command:
curl -X POST -w "\nStatus: %{http_code}\n" --header "Content-Type: application/json" --header "Accept: application/json" --header "Authorization: <your scoped api-key>" -d @event.json "<analytics_hostname>:8090/analytics/api/v1/events"
Verify the transmission of new events
In the Command Prompt with the console consumer running, check for new event entries.
You can also list all previous events:
kafka-console-consumer --zookeeper localhost:2181 --topic AUTOMIC_..._ds-edda_<CLIENTID>-events --from-beginning
If new items are displayed in the Kafka console consumer output, it indicates that your events have been written to the event topic on Streaming Platform.
Step 5 - Check if Flink processes your Rule correctly
Check for exceptions in Apache Flink Rules
In this step you are going to verify whether Apache Flink can process your rules correctly using the following steps:
-
Open the Flink Dashboard by accessing the URL http://<hostname>:8081 in a Web browser.
Note: The default web.port is 8081 defined in <AUTOMIC>\External.Resources\flink\flink-1.10.1\conf\flink-conf.yaml
- In the Dashboard, check your Rule jobs in the Overview perspective and look for FAILED jobs in the Completed Jobs section.
-
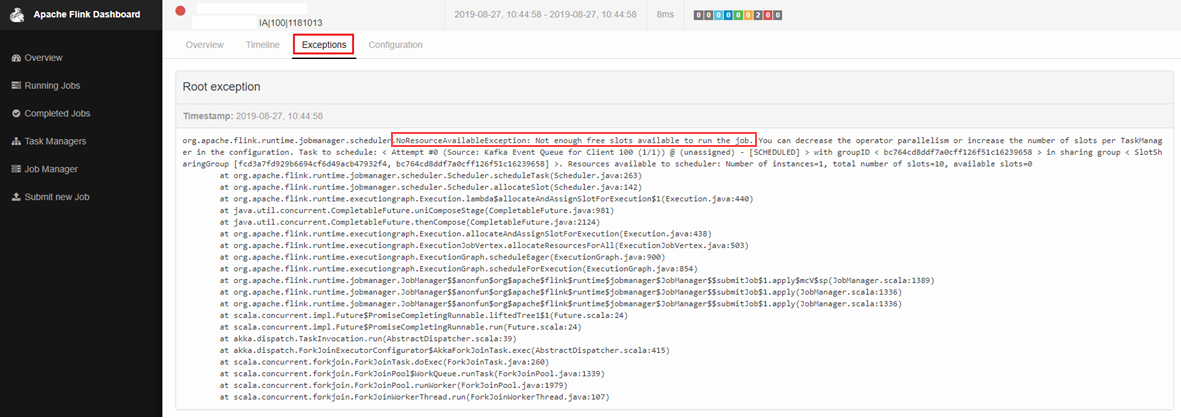
Click on any FAILED job and check the Exceptions page for details on potential root causes for the error.
Exceptions example: The following example displays a failed job with the error NoResourceAvailableException. This failed job is because too many Rules have started, and there is not enough free slots available on Flink. To resolve the issue you can set a bigger slot value to taskmanager.numberOfTaskSlotsin <AUTOMIC>\External.Resources\flink\flink-1.10.1\conf\flink-conf.yaml file.
Further Debugging in case the rule is running
-
In the Apache Flink Dashboard, click Task Managers, and then select the taskmanager your Flink job is running on:
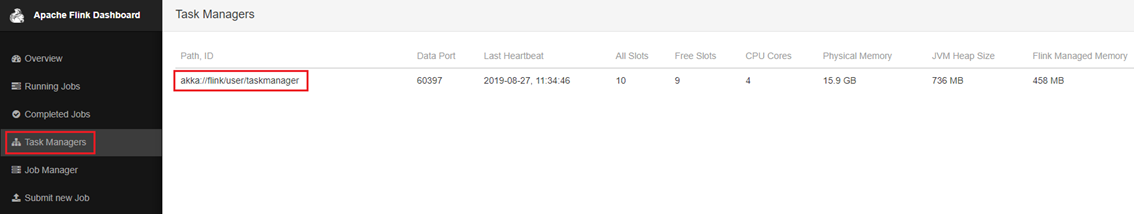
-
Click Logs and search for triggers with variables
Note: Loading the logs can take some minutes.
If you can see similar log line for your Rule like the following:
Rule 'PCK.AUTOMIC_RULE_SIMPLE.PUB.SIMPLE.NEW.1' (1181016) triggers with variables {TEMPERATURE#=32, CITY#=Vienna}
than you can make sure that your Rule on Flink cluster is working correctly and a Rule has been triggered successfully and the event definition variables are mapped with the prompt set variables of the promptset belongs to the AE trigger job.
Note: If the logfile is too big to load in browser, than you can open it in an editor. You can find jobmanager/taskmanager logfiles located in the following directory:
<AUTOMIC>\External.Resources\flink\flink-1.10.1\log
Step 6 - Make sure the trigger event is written back into the Kafka trigger topic
After you have ruled out an error in Flink, you should verify that the Kafka trigger topic transports the messages from Flink correctly.
Attach a console consumer to the trigger topic
-
First list all topics on Kafka
kafka-topics --zookeeper <host>:<port> --list
Note:A Zookeeper connection string is required in the form host:port. The default Zookeeper port is 2181.
-
Find the trigger topic from the outputted list that matches the following pattern:
AUTOMIC_<hash value>_ds-edda_trigger
-
Copy the trigger topic name and then add it to a console consumer:
kafka-console-consumer --bootstrap-server <kafka host>:<kafka port> --topic AUTOMIC_..._ds-edda_trigger
Note: The Kafka bootstrap server connection string can be found in the Analytics Backend application.properties file:
<Automic>\Automation.Platform\Analytics\backend\application.properties
############################
## Message Queue settings ##
############################
# Kafka
#######
# Specify Kafka hosts
kafka.bootstrap_servers=localhost:9092
Send a trigger event with Postman or cURL
Send a trigger event using the Event Engine REST API. The following example is made using cURL:
curl -X POST \
http://<backend.endpoint>:<server.port>/analytics/api/v1/events \
-w "\nStatus: %{http_code}\n" \
-H 'Authorization: <your scoped api-key>' \
-H 'Content-Type: application/json' \
-H 'Cache-Control: no-cache' \
-d '{
"type": "EVENTDEF_TEMPERATURE",
"values":
{
"city": "Vienna",
"temperature": 32
}
}
'
If new items appear in the trigger topic, you can ensure the trigger event has been written back into the trigger topic in Kafka.
Example:
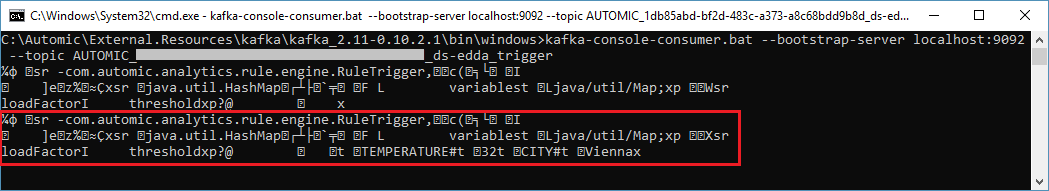
Note: Data is not in a human readable format