Comparing your CDA System Performance with Reference Data

As an Administrator, you can compare the performance of your system with the reference data that is provided in this topic. The following metrics have been collected from a system where the Release Manager, Automation Engine, Automic Web Interface, and their databases are installed on one computer. See: Installation Scenarios for CDA

This page includes the following:

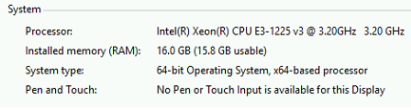
OS: Windows Server 2016
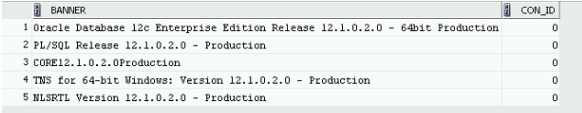
Image showing reference data for Windows Server 2016

Database: Oracle

Image showing configuration data for oracle database

Values

  • AE time (ms)
  • Total time (ms)
  • Deployment node = Component Target assignment

Execution

The deploy workflow is executed to deploy the DemoApp.

Generate Deployment Descriptor

Deployment Node Chart Time
1
  • 100 executions
  • A new execution starts every 15s

Graphic depicting deployment descriptor chart for one deployment node

total_time

  • Average: 93.60
  • Standard Deviation: 9.41
2
  • 100 executions
  • A new execution starts every 15s

Graphic depicting deployment descriptor chart for two deployment nodes

total_time

  • Average: 169.95
  • Standard Deviation: 9.37
10
  • 100 executions
  • A new execution starts every 30s

Graphic depicting deployment descriptor chart for ten deployment nodes

total_time

  • Average: 383.93
  • Standard Deviation: 43.48

Create Execution

Deployment Node Chart Time
1
  • 100 executions
  • A new execution starts every 15s

Graphic depicting create execution chart for one deployment node

total_time

  • Average: 95.29
  • Standard Deviation: 11.26

2
  • 100 executions
  • A new execution starts every 15s

Graphic depicting create execution chart for two deployment nodes

total_time

  • Average: 171.29
  • Standard Deviation: 8.56
     
10
  • 100 executions
  • A new execution starts every 30s

Graphic depicting create execution chart for ten deployment nodes

total_time

  • Average: 390.75
  • Standard Deviation: 58.61
     

Start Execution

Deployment Node Chart Time
1
  • 100 executions
  • A new execution starts every 15s

Graphic depicting start execution chart for one deployment node

ae_time

  • Average: 52.17
  • Standard Deviation 16.51

total_time

  • Average: 56.28
  • Standard Deviation: 16.59
2
  • 100 executions
  • A new execution starts every 15s

Graphic depicting create execution chart for two deployment nodes

ae_time

  • Average: 52.17
  • Standard Deviation 16.51

total_time

  • Average: 56.28
  • Standard Deviation: 16.59
10
  • 100 executions
  • A new execution starts every 30s

Graphic depicting create execution chart for ten deployment nodes

ae_time

  • Average: 106.09
  • Standard Deviation: 35.03

total_time

  • Average: 122.58
  • Standard Deviation: 35.90

Get Agent List

Get Agent List Chart Time
 
  • Starts every minute

Graphic depicting get agent list chart

ae_time

•Average: 23.40

•Standard Deviation: 2.28

total_time

•Average: 24.16

•Standard Deviation: 2.28

Read Vara

Read Vara Chart Time
 
  • VARA is read every 30 seconds

graphic depicting read vara chart

ae_time

  • Average: 37.27
  • Standard Deviation: 1.22

total_time

  • Average: 37.38
  • Standard Deviation: 1.27

Login to AE

Login to AE Chart Time
 

graphic depicting login to ae chart

total_time

  • Average: 182.61
  • Standard Deviation: 151.14