Monitoring Your First Schedule
This topic is interesting for first users of Automic Automation. It introduces you to the monitor of the Schedule that we have created in the Getting Started guide at Creating Your First Schedule Object.
Accessing the Schedule Monitor
The monitor is available as soon as you execute the Schedule. You can access it immediately by clicking the Open Monitor link that pops up at the top of your screen after executing the Schedule, or later in one of the following ways:
-
From the Process Monitoring perspective
Right-click the Schedule in the Tasks list and click or middle-click the Open Monitor menu option
-
From the Process Assembly perspective
Right-click the Schedule that you have executed and click or middle-click the Last Monitor menu option
Monitoring JSCH.DISK.SPACE.QUERY
The monitor of our Schedule looks like this:
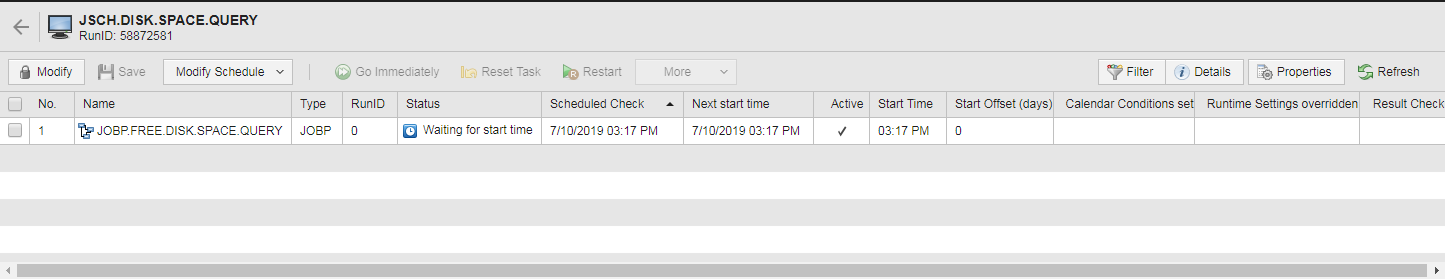
For a detailed description of its elements, see Schedule Monitor Overview.
From the Schedule monitor you can access the Schedule Execution Data and Reports. To do so, expand Modify Schedule and select Open Report or Execution Lists > <Activator/Child Task/Parent Task> Executions. Combining these data with the information provided in The Task List, you have a clear picture of how the Schedule and its tasks are performing.
See also: