Creating A VARA to Grid Using Dynamic Filters
The VARA to Grid dynamic filter feature lets administrators or designers create grids and dashboards based on KPIs.
What Will You Learn?
How to create a multi-grid dashboard using one VARA object and dynamic filters.
What does this use case cover?
This use case is based on the use of the grid dynamic filters feature. Grids in this use case are accessible to various users, however each user type has a particular filter and limitation applied to their view. The use case is based on a international shoe company.
All of the company’s stores shoe sales (number of shoes sold) are collected and consolidated on a nightly basis. Store stocks are replenished each night using an application that is automated by Automic Automation.
Important: This use case is based on previously created grids. The objective of this use case is to demonstrate how filters can be implement based on users types and filters. Therefore this use case does not show you how to create grids.
This use case is based on three types of user:
- Dashboard or Grid Designer
The shoe company describes this user as the Automic Automation champion. The designer pushes the Automic Automation adoption inside the company, and ensures that Automic Automation is always operational. This user is also responsible for providing dashboards to the Local Store Manager and Regional Manager to ensure that they fulfill their KPIs. - Local Store Manager
The local store manager ensures that sales results and KPIs (Key Performance Indicators) are aligned at a local level. This user has a limited dashboard and grid view based on their local store. - Regional Manager
This is a business user with a high-level view of the dashboards. This user has access to shoe sale results in the following regions: EMEA, Asia, America, and Oceania. The regional manager ensures that sales results and KPIs (Key Performance Indicators) are aligned across regions.
Why should I use filters?
The following use case is based on a set user types, and there are many scenarios where filters can be useful to your organization:
- If you only want specific users to have access to data that only concerns them.
- If you do not want a user to modify or filter a grid because of sensitive data.
- If as a user you only require a sub-set of the VARA object data.
Overview
The following list provides an overview of the steps you must carry out:
Prerequisites
- Knowledge of how to create and use VARA objects in AE
- Knowledge of user access right in AWI
- Make sure that you have a VARA object ready to create your grids. In this use case you only need one VARA to create all the dashboard grids.
Creating the users in AWI
As a designer you have been given administrator rights in AWI. The first goal is to create the three users and manage their access rights.
-
Log into AWI as the designer (administrator). Click Administration button from the on main toolbar.
-
In the User Management section, add the following users: EMEA_MGR and PARIS_MGR.
-
Add the access rights for each user.
In this use case the following rights are assigned:
- EMEA_MGR user
Read access to dashboards that only display EMEA sales results
Read access to the EMEA VARA results only
Read access to a folder called EMEA
Note: The company does not want regional managers to have access to other regional sales results. - PARIS_MGR user
Read access to one specific dashboard based on the Paris store
Note: The company does not want local managers to have access to other local sales results.
- EMEA_MGR user
The EMEA Sales Results VARA
The columns in the VARA.RESULTS.EMEA.GRID object displayed below can be described as follows:
- Key
The Key column contains all country store identifiers, denoted by country_store number, for example AU_Store. - Value 1
Contains the current month shoes sales for each store - Value 2
Represents a store's yearly objective for shoes sales - Value 3
Displays the city location of each store - Value 4
Represents a country name which corresponds to a city store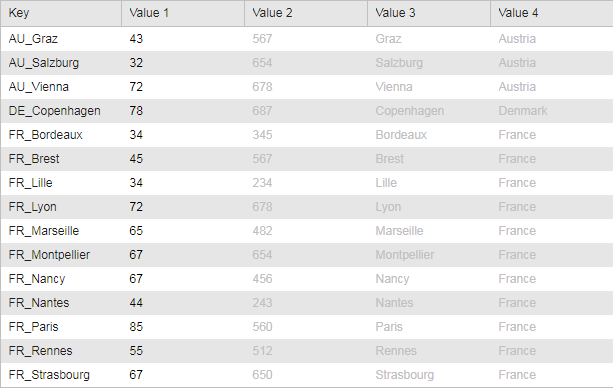
The Regional Managers View
The EMEA_MGR (regional manager) user has read access to all the data in VARA grid object. A regional manager can view all data based on their sales region, this is useful to view healthy and poor performing sales regions.
An automated job collects data from each store, and consolidates data per country. The EMEA manager can view their dashboard each day:
- Shoe sales for individual city stores in a particular country
- An overview of shoe sales for all EMEA countries
- Month and year shoe sale objectives per country based on all stores in a particular country
Example:
The regional manager has asked the grid designer to create a default grid view each time the user logs into AWI.
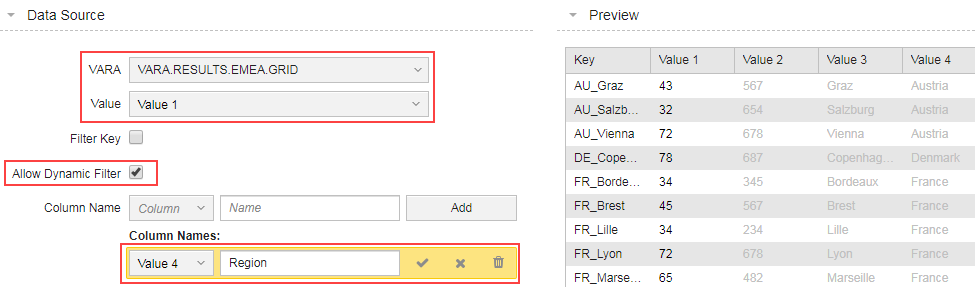
In the Data source section the grid designer makes the following configuration:
- Selects the VARA.RESULTS.EMEA.GRID object from the VARA combo box.
- Value 1 is selected from the Value drop-down list. This sets the default grid to display all the EMEA stores current months objective in the grid.
- The Allow Dynamic Filter is box is checked. Value 4 is selected from the Column drop-down list and is named Region. Finally the Add button is click to add filter.
The Data source is configured as follows:
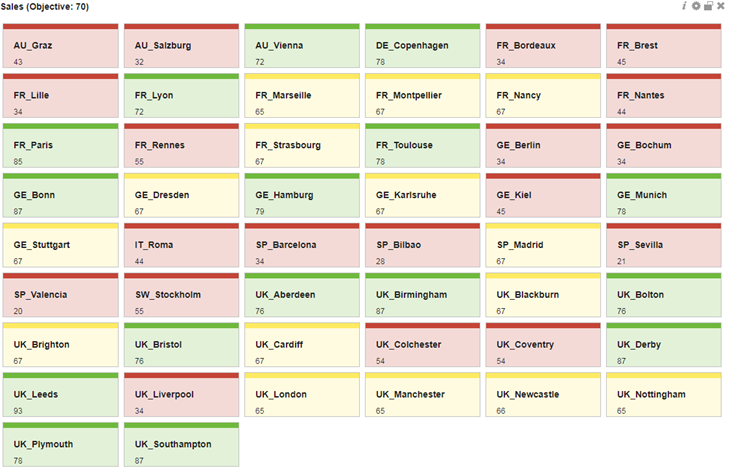
In the Configuration section the grid designer makes the following configuration:
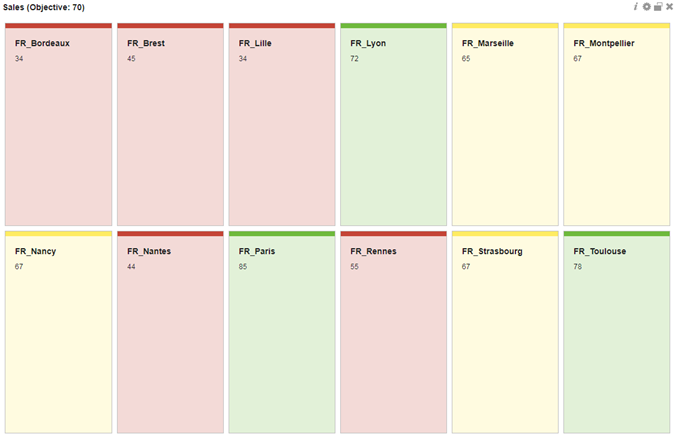
- In the Title box Sales (Objective: 70) is entered
- The grid Columns is set to 6 columns
- The Show Key box is checked
- In the Mapping section the following numbers are mapped:
- 0-55
A red grid shows that a store is poorly under current objective - 56-69
A yellow grid shows that a store is moderately under current objective - 70-1000
A green grid shows that a store is on target for current objective
- 0-55
The Grid Configuration is configured as follows:

As a result of the designers configuration, the grid below shows each EMEA country's aggregated (across all the county stores) current month shoes sales, and yearly sales objective.
More information: VARA to Grid Widget
When the EMEA_MGR user is in the grid view, the user is able to filter data by Region and stores because the Dynamic Filter is applied.
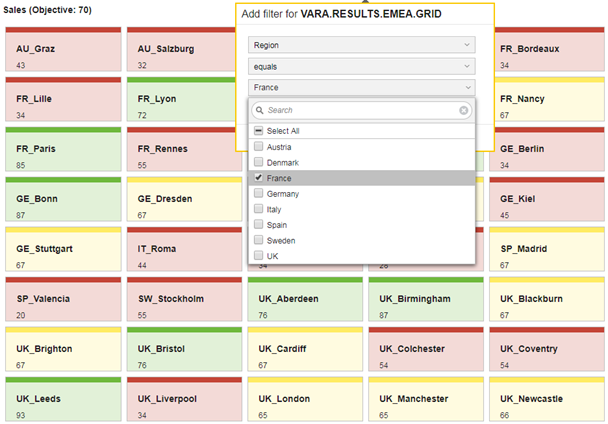
The regional manager can see all the under performing stores in France, set up a meeting with the local manager to discuss any issues with specific store objectives.
The Local Managers View
A local manager can only view data based on their local store sales. They do not have access to the Dynamic Filter feature as it has not been activated.
Example:
In the Data source section the grid designer makes the following configuration:
- Selects the VARA.RESULTS.EMEA.GRID object from the VARA combo box.
- Value 1 is selected from the Value drop-down list. This sets the default grid to display all the EMEA stores current months objective in the grid.
- The Filter Key is box is checked. The start with option is selected from the Key drop-down list. In the text box the designer has enter FR to filter all stores in France.
Note: The Allow Dynamic Filter checkbox is not checked (deactivated).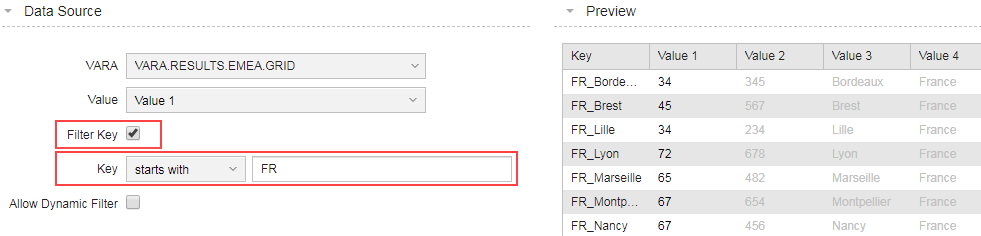
Important!
- Although all EMEA store managers use the same VARA object to view their grids, the dashboard designer has limited their view to local stores.
- The local store manager data access is limited to one row of data in the VARA object.
The local store manager can view the current months sales objective only.
Note: If the user clicks on the grid, the notice Dynamic Filtering is not allowed on this VARA is displayed.
Useful Links