Creating VARA to Charts Using Dynamic Filters
The VARA to Chart dynamic filter feature lets administrators or designers create charts and dashboards according to user access rights and organizational roles.
What Will You Learn?
How to create a multi-chart dashboard using one VARA object and dynamic filters.
What does this use case cover?
This use case is based on the use of the chart dynamic filters feature. Charts in this use case are accessible to various users, however each user type has a particular filter and limitation applied to their view.
The use case is based on a international shoe company that sells its shoes globally.
All of the company’s stores shoe sales (number of shoes sold) are collected and consolidated on a nightly basis. Store stocks are replenished each night using an application that is automated by Automic Automation.
The company objective is to ensure that each store has enough stock for the start of business the following morning.
Important! This use case is based on previously created charts. The objective of this use case is to demonstrate how filters can be implement based on user access rights and filters. Therefore this use case does not show you how to create charts.
This use case is based on three types of user:
- Dashboard or Chart Designer
As a Automic Automation champion she pushes the Automic Automation adoption inside the company, and ensures that Automic Automation is always operational. This user is also responsible for providing dashboards to the Local Store Manager and Regional Manager to ensure that they fulfill their KPIs. - Local Store Manager
The local store manager ensures that sales results and KPIs (Key Performance Indicators) are aligned at a local level. This user has a limited local store dashboard and chart view. - Regional Manager
This is a business user with a high-level view of the dashboards. This user has access to shoe sale results in the following regions: EMEA, AMER or APAC. The regional manager ensures that sales results and KPIs (Key Performance Indicators) are aligned across regions.
Why should I use filters?
The following use case is based on a set user types, and there are many scenarios where filters can be useful to your organization:
- If you only want specific users to have access to data that only concerns them.
- If you do not want a user to modify or filter a chart because of sensitive data.
Overview
The following list provides an overview of the steps you must carry out:
Prerequisites
- Knowledge of how to create and use VARA objects in AE
- Knowledge of user access right in AWI
- Make sure that you have a VARA object ready to create your charts. In this use case you only need one VARA to create all the dashboard charts.
Creating the users in AWI
As a designer you have been given administrator rights in AWI. The first goal is to create the three users and manage their access rights.
-
Log into AWI as the designer (administrator). Click Administration button from the on main toolbar.
-
In the User Management section, add the following users: EMEA_MGR and PARIS_MGR.
-
Add the access rights for each user.
In this use case the following rights are assigned:
- EMEA_MGR user
Read access to dashboards that only display EMEA sales results.
Read access to the EMEA VARA results only.
Read access to a folder called EMEA.
Note: The company does not want regional managers to have access to other regional sales results. - PARIS_MGR user
Read access to one specific dashboard based on the Paris store and the EMEA VARA results.
Note: The company does not want local managers to have access to other local sales results. - More information: Granting Automation Engine Authorizations and Users (USER)
- EMEA_MGR user
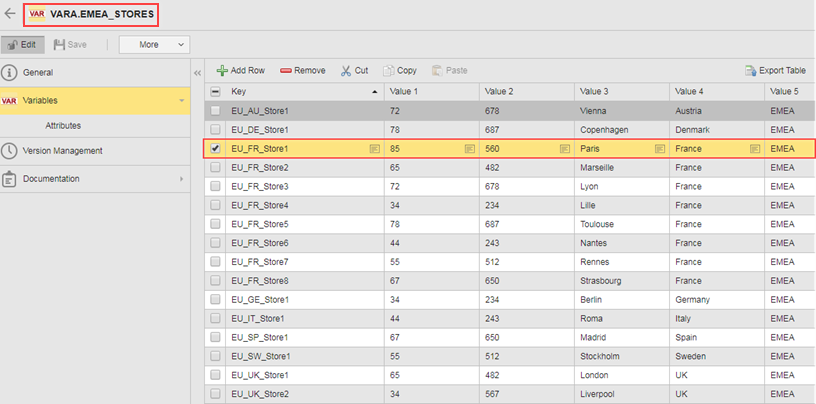
The EMEA Sales Results VARA
In this use case it is essential that the VARA object data content is explained, as the design is relevant to the dynamic chart views. The columns in the EMEA.RESULTS.VARA object displayed below can be described as follows:
- Key
The Key column contains all country store identifiers, denoted by country_store number, for example UK_Store1.
There is an exception! The Key column also contains names that use the identifier Global_Country, for example Global_FR. These names represent all the stores in a county, for example Global_FR represents France_Store1, France_Store2, France_Store3, and so on. - Value 1
The Value 1 column contains the current month shoes sales for each store. The global value represents the aggregated shoe sales of all stores in a country. - Value 2
The Value 2 column represents a store's yearly objective for shoes sales. The global value represents the aggregated sales objective for all stores in a country. - Value 3
The Value 3 column displays the city location of each store. The country names also appear in this column. These names correspond to the Key value Global_Country.
Example: The Key value Global_GE corresponds to Germany in the Value 3 column. - Value 4
The Value 4 column represents a country name which corresponds to a city store. The name Aggregate appears in this column as well, this represents each country aggregate sales.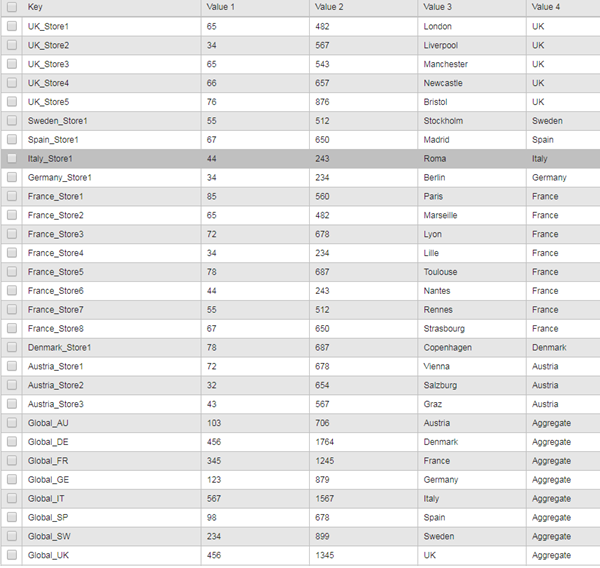
Why use the aggregate values in the same VARA object?
Essentially the usage of global (aggregated) values in the one VARA object is a time saving exercise. As a dashboard designer there is no need to create multiple data sources for your dynamic charts.
This use case shows you how to filter and display several data sets using one VARA object. The VARA object is a flat data file, but by creating a Global key you can take advantage of the Allow Dynamic Filter option. It allows you to have a standard view of each countries overall sales, and simulates drill-down into all the stores associated with a country. This concept is explained in the example below.
The Regional Managers View
The EMEA_MGR (regional manager) user has read access to all the data in EMEA.RESULTS.VARA object. A regional manager can view all data based on their sales region, this is useful to view healthy and poor performing sales countries.
An automated job collects data from each store, and consolidates data per country. The EMEA manager can view their dashboard each day:
- Shoe sales for individual city stores in a particular country.
- A global view of shoe sales for all EMEA countries.
- Aggregate (month and year) shoe sales per country based on all stores in a particular country.
Example:
The regional manager has asked the chart designer to create a default chart view each time an AWI login is made.
Based on the regional manager's request:
- The chart designer selects the EMEA.RESULTS.VARA object from the VARA combo box.
- The Filter Key in the chart Data source section is set to Global.
All values using the Global key are filtered and are displayed in VARA preview. The Global Key contains aggregated data for all countries in the EMEA sales region. See above for the VARA column descriptions.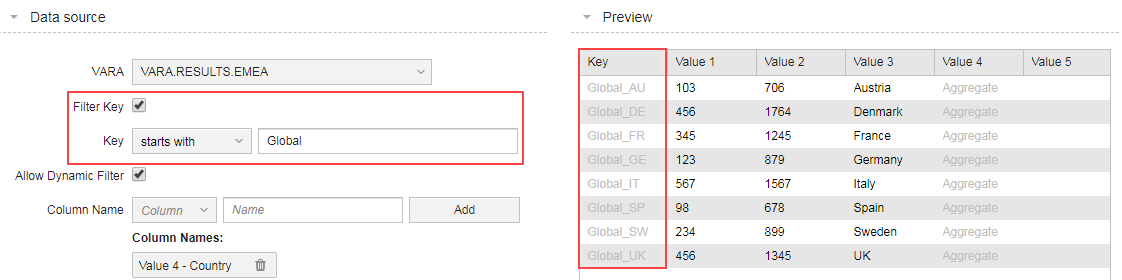
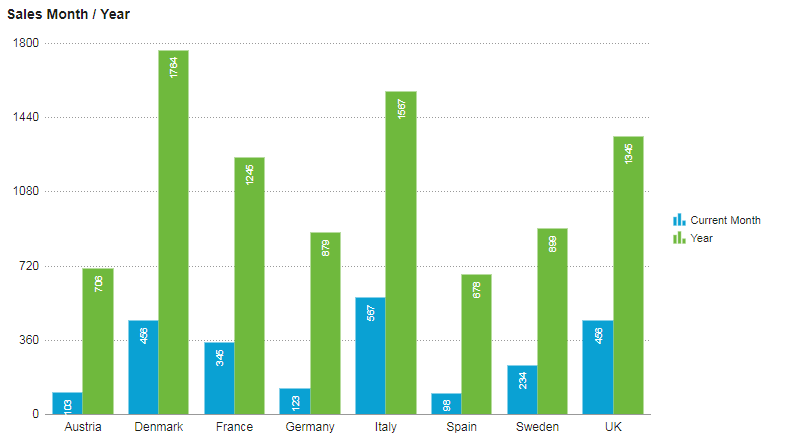
As a result of the designers configuration, the chart below shows each EMEA country's aggregated (across all the country stores) current month shoes sales, and yearly sales objective.
More information: VARA to Chart Widget
The regional manager now requires more details about the individual store sales in each country.
Note: The Filter Key option is still set to filter everything that starts with Global in the VARA object.
- The chart designer checks the Allow Dynamic Filter box in the Data source section.
- In the Column Name section, the designer selects Value 4 from the Column drop-down list. The column Value 4 is named Country.
Important! It looks counter-intuitive that designer has selected the Value 4 and not the Value 3 column. This is because the Value 3 column is reserved for chart labels. When the designer sets the filter for Column 4, the dynamic filter will list the labels, Austria, Denmark, France and so on.
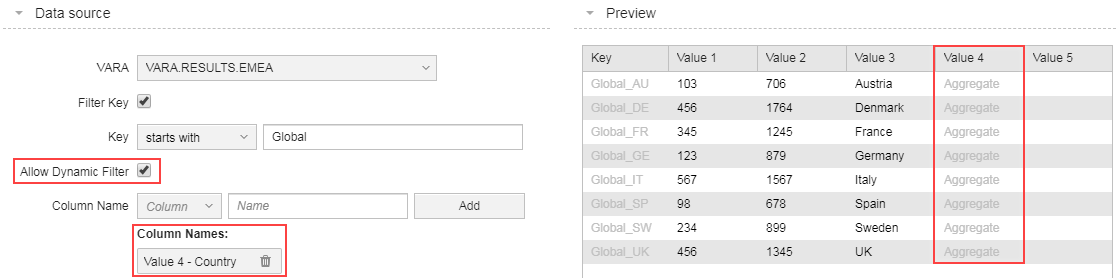
When the EMEA_MGR user is in the chart view, the user is able to filter data by country and stores because the Dynamic Filter is applied on Filter Key Global.
The Local Managers View
A local manager can only view data based on their local store sales. They do not have access to the Dynamic Filter feature as it has not been activated.
Example 1:
The dashboard designer has specifically filtered the Paris store (EU_FR_Store1) in the VARA object. The Allow Dynamic Filter checkbox is not checked (deactivated).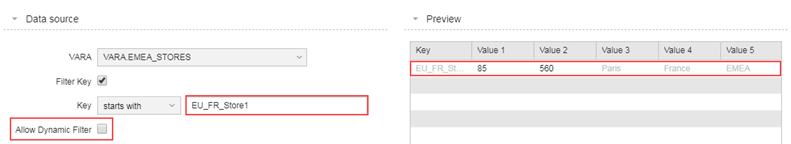
Although all EMEA store managers use the same VARA object to view their charts, the dashboard designer has limited each chart view.
The Paris store manager data access is limited to one row of data in the VARA object:
The Paris manager can only view the current months sales and the yearly sales objective for the Paris store.
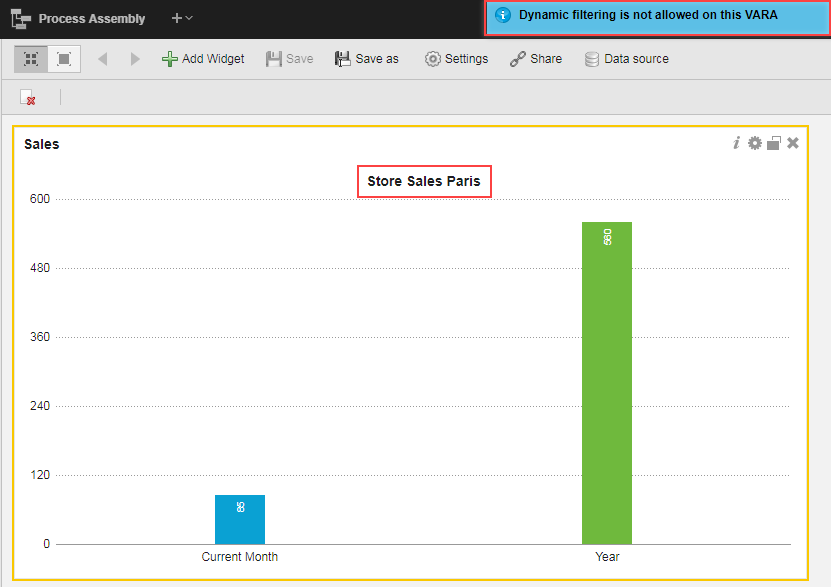
Note: If the user clicks on the chart, the notice Dynamic Filtering is not allowed on this VARA is displayed.
Example 2:
The EMEA manager decides to encourage competition between city stores, and asks the designer to setup a dynamic filter. The dynamic filter allows all local managers to view other city store sales.
In this example below the Paris store manager has access to the dynamic filter. The Column Name Value 3 is named EMEA cities, and added as a filter. All city stores in the Value 3 column are now accessible to local city managers.
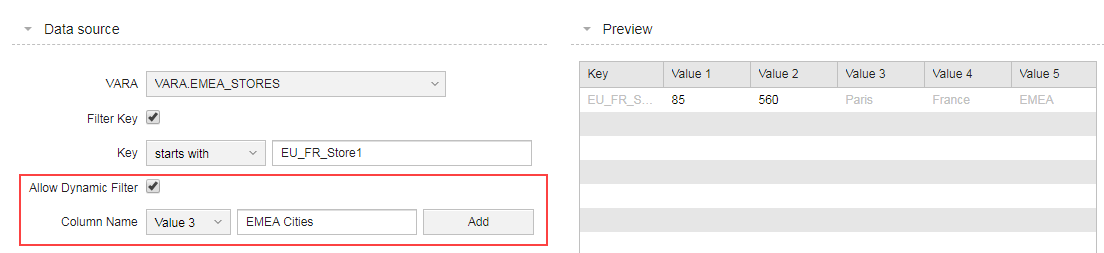
The Paris manager has access to the data in columns Value 1, 2 and 3 in the VARA object.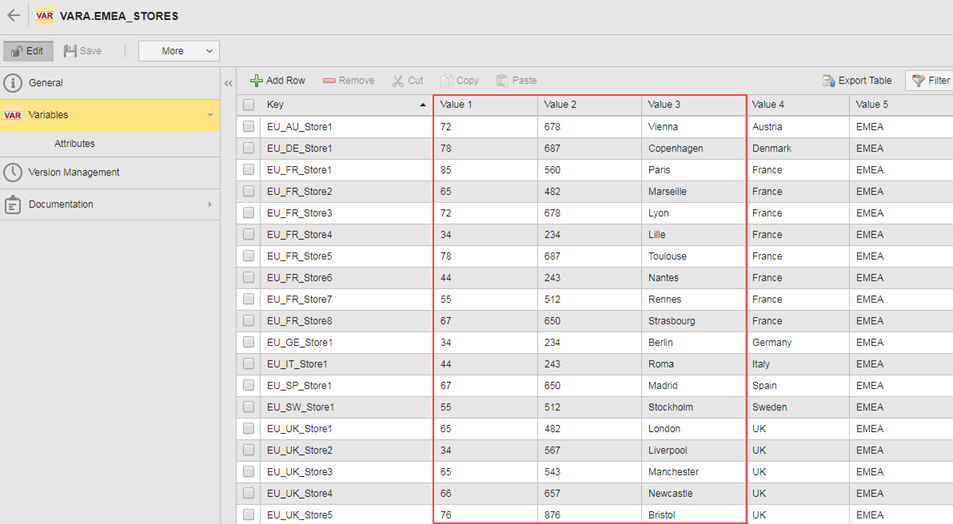
The Allow Dynamic Filter is activated in the chart view, and any city store can be selected from the list.
Useful Links