Analytics Widgets
Analytics widgets provide insights into key metrics and historical data. They are highly customizable and you can share them with other users.
You can create the following widgets:
Data Source
The following data can be loaded to be used in Analytics: Jobs, Workflows, Application Deployments, and Service Fulfillments.
For further information about Data Source, see: Working with Dashboards
Note: Workflows and Application Deployments are only available if the CDA plug-in is installed.
Sharing Reports
This functionality can be used to share the dashboard content with people without access to AWI using URL. The generated link can be manually added to any form of written communication, for example: e-mail, documents, SharePoint, wiki, and so on.
Drill-down Capabilities
More detailed information can be displayed by clicking a specific column or slice of a chart.
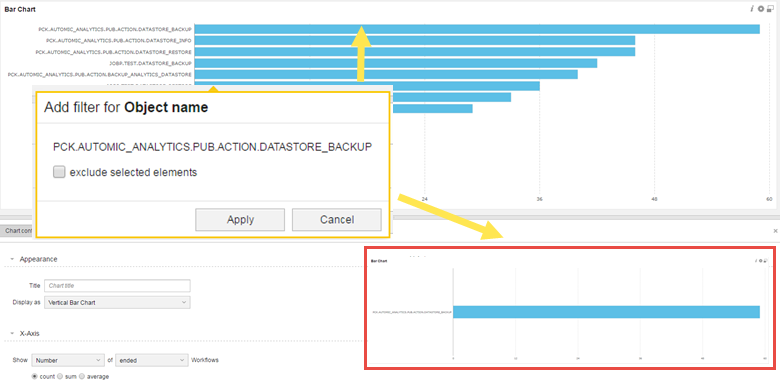
Example
The following chart shows the number of ended Workflows by object name. You can click one of the Workflow names to access additional information:
Timezones
Analytics uses UTC as Standard Time timezone. Data that is displayed in UTC can only be converted into one of the following supported timezones:
-
CET (UTC+02:00)
-
MET (UTC+02:00)
-
GB (UTC+01:00)
-
PST8PDT (UTC-07:00)
-
MST7MDT (UTC-06:00)
-
CST6CDT (UTC-05:00)
-
EST5EDT (UTC-04:00)
-
ROK (UTC+09:00)
-
PRC (UTC+08:00)
-
W-SU (UTC+03:00)
-
WET (UTC+01:00)
-
GMT (UTC+00:00)
-
NZ (UTC+13:00)
-
NZ-CHAT (UTC+13:45)
For more information about timezones and how to define them, see Time Zone (TZ).
Important! Timezones that are only listed in the table earlier are supported. If you are using a timezone object whose name is not supported, fallback to UTC is used.
Notes:
-
When defining timezones different from CET, and GMT the TZ TimeZone object must be selected. Naming conventions are as follows: TZ.{timezone abbreviation}, where the TZ prefix is optional.
-
Title must be left empty.
-
To apply the new time zone for the Analytics widget, log out and in again to AWI.
-
Shared dashboards use the same timezone that is defined for the user who shared them.