Monitoring Run DAG Jobs
When you execute an object in Automic Automation, the corresponding task is visible in the list of Tasks in the Process Monitoring perspective. The Process Monitoring gives you the full range of possibilities to monitor, analyze, identify problems and remediate them. If you want to learn more about how to monitor your jobs, please refer to the Automic Automation product documentation at Monitoring Tasks.
A Run DAG Job in your cloud solution contains multiple tasks. If you have configured the Job with the Show Child Tasks In Process Monitoring option selected, the Process Monitoring perspective displays the executed Automic Automation Run DAG Job (parent) and the child tasks (the children in the cloud environment). This screenshot shows an Automic Automation Run DAG Job called JOBS.AIRFLOW.RUNDAG.NEW1 that has executed and ended OK. If you expand it, you can see its children, namely, the tasks executed on the corresponding cloud solution:
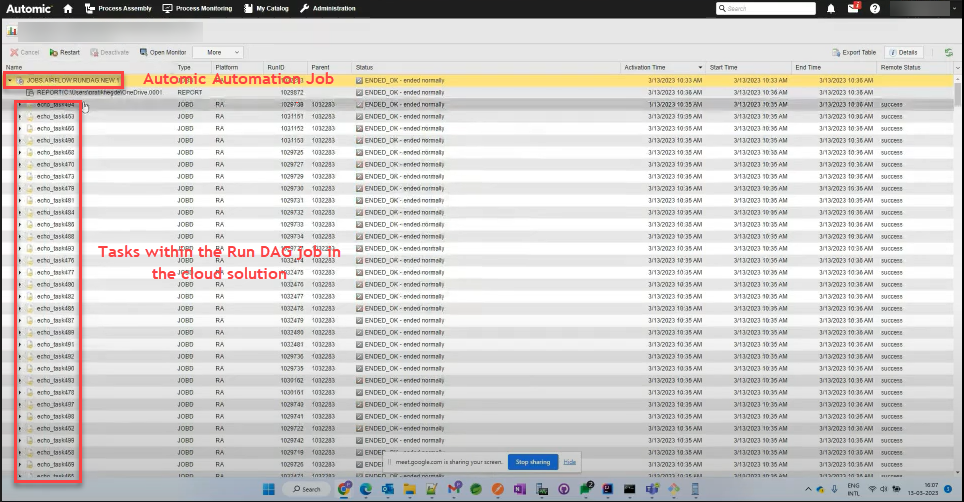
Parent
Automic Automation assigns the Run DAG Job the same Run ID that the job has on the cloud solution where it originally executes. It is displayed in the RunID column.
Children
Automic Automation assigns the child tasks the same Run ID that they have on the cloud solution where they originally execute. The Parent column displays the runID of its parent, namely, the DAG Job.
DAG Job Statuses
The Process Monitoring perspective contains two status-related columns:
-
Status
This column shows the status of the Automic Automation Run DAG and its children.
-
Remote Status
This column shows the status of the Run DAG and of its children on the cloud solution.
Possible Statuses of the Parent DAG (Status Column)
The parent job is completed only when the DAG is completed on the cloud solution. It can have the following statuses:
-
While executing: Active
An Active status in Automic Automation corresponds to the following statuses on the cloud solution:
-
queued
-
running
-
-
On completion
-
ENDED_OK
It corresponds to success and skipped on the cloud solution
-
ENDED_NOT_OK
It corresponds to failed on the cloud solution
-
Possible Statuses of the Children DAG Tasks (Status Column)
The child tasks can have the following statuses:
-
While executing
A Active status in Automic Automation corresponds to the following statuses on the cloud solution:
-
queued
-
scheduled
-
up_for_retry
-
up_for_reschedule
-
running
-
restarting
-
-
On completion
-
ENDED_OK
-
ENDED_NOT_OK
-
Possible Remote Statuses of DAG Tasks
Automic Automation retrieves and displays the following remote statuses from the target cloud solution:
-
running
-
success
-
skipped
-
failed
Monitoring DAG Job Details
-
Go to the list of tasks in the Process Monitoring perspective.
-
Find and right-click the DAG or the child and click the Details button.
The Details pane opens on the right-hand side and shows a summary of the execution of the selected task. The Object Name and the Remote Status data are those reported by the cloud solution. The rest of the data here pertain to the execution of the DAG in Automic Automation, not on the cloud solution.
Agent Connection
If the Agent stops working or loses connection, the Job execution stops but resumes as soon as the Agent is connected again.
Reports
When jobs are executed, Automic Automation generates output files and reports that you can open from the user interface. Combined with the Execution Data, these reports provide comprehensive information about the status and the history of your executions. This information tracks all processes and allows you to control and monitor tasks, ensuring full auditing capability.
Reports are kept in the system until they are explicitly removed by a reorganization run. During a reorganization run, the Execution Data can be kept. Keeping the execution data is an advantage, because reports can consume a large amount of hard drive space. Removing the reports from your database does not mean loss of important historical data.
The following reports provide a comprehensive insight into the executions of your jobs:
-
Agent log (PLOG)
This report captures everything that has to do with the Job execution from the Automic Automation perspective: When the Job started, the Job configuration parameters, whether there has been any validation and its results, and so on, It also contains the response received from the target system but in a format that cannot be parsed for further processing.
Since this report logs all that happens during the execution, it is your first place to go if you need to troubleshoot issues, also if those issues have to do with the configuration of the Job. For example, if you use variables to populate the configuration fields, these variables are resolved at runtime. This report show the actual variable values and not their names.
If the Job has been executed with the Show Child Tasks In Process Monitoring option selected, only the parent task contains this report.
-
Report (REP)
This report captures the information that the target system sends to Automic Automation when the Job is executing/has executed. It contains all relevant information about the Job execution and its results. It provides this information in a format that can be easily parsed for further processing (JSON, XML and so on).
You will most probably include the Jobs in other Automic Automation objects such as Workflows or Schedules to orchestrate operations. When you do so, you can use the content of this report on the Post Process pages of the Job definition to trigger further actions based on that content. For more information see, Process Pages in the Automic Automation product documentation.
If the Job has been executed with the Show Child Tasks In Process Monitoring option selected, each child task has its own Report (REP).
-
Directory
This report provides the list of job output files that the job has created for this particular execution and that are available for downloading.
To Access the Reports
Do one of the following:
-
From the Process Assembly perspective
-
After executing a Job, a notification with a link to the report is displayed. Click it to open the Last Report page.
-
Right-click a job and select Monitoring > Last Report.
In either case, the most recent report that is created for the object opens up.
-
-
From the Process Monitoring perspective
-
Right-click a task and select Open Report.
The report of that particular execution opens up. Its runID is displayed in the title bar to help you identify it.
-
In the list of Executions for a particular task, right-click and select Open Report.
-
When defining the Run DAG Job you can specify whether either just the parent (the DAG) or both the parent and its child tasks should be displayed in the Process Monitoring perspective after executing it. You specify this by selecting or not selecting Show Child Tasks In Process Monitoring on the Run DAG Job page.
This is what happens depending on your definition:
-
The child tasks are displayed in the Process Monitoring perspective
The report of the individual tasks is available separately for each task in its Job Report.
-
The child tasks are NOT displayed in the Process Monitoring perspective
The report of the individual tasks is available in the parent (DAG) Job Report
See also: