Sysload Portal has incorporated a spreadsheet feature to add more flexibility when reporting capacity data. By working in a Spreadsheet, you work in an interface you are familiar with; it is similar to working in MS Excel. You have the ability to create new capacity metrics, that are the result of a consolidation of metrics contained in the Sysload database (Sysload GUI will help creating the data sources). You can easily create:
To create a new spreadsheet:
New spreadsheet
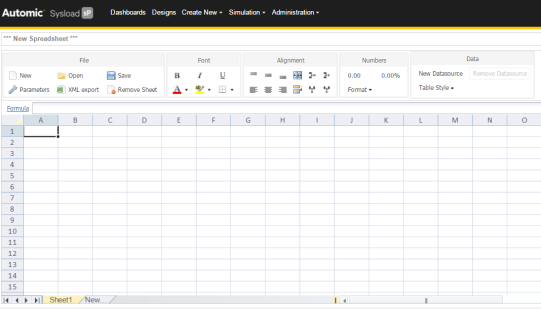
After you have selected the new spreadsheet option from the "Create New" menu, you will notice a “ribbon” type menu with various options displayed. The Font, Alignment, and Numbers are standard spreadsheet features and are self-explanatory. The File and Data menu are described below.

Spreadsheet ribbon type menu
The file menu enables you to manage your spreadsheet, the features are explain in the table below.
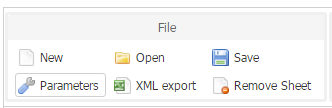
File menu options
|
Item |
Description |
|---|---|
|
New |
Creates a new "empty" instance of a spreadsheet. |
|
Open |
The "Open" pane is displayed which lists all saved spreadsheets. |
|
Save |
Saves your current spreadsheet and displays the "Save" pane. |
|
Parameters |
Displays the "Parameters" pane. Enables you to modify your spreadsheet name and target folder. Refer to Save Pane Description |
|
XML Export |
Exports your spreadsheet in XML format using the following syntax yyyy-mm-dd_<spreadsheet_name>. Note: The date syntax correspond to the actual date of the download generation and not the spreadsheet creation date. Note: When you export a spreadsheet the datasource style is not exported. Your exported file can be opened in MS Excel. If you are using a version prior to 2011, then you may have to specify XML as the file type to open. |
|
Remove Sheet |
Removes current spreadsheet. |
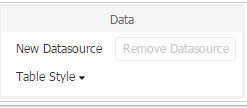
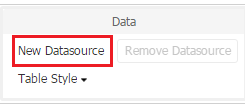
New datasource
Data Menu Options
|
Item |
Description |
|---|---|
|
New Datasource |
Opens the "New Datasource" pane. Refer to Spreadsheet |
|
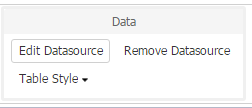
Edit Datasource |
Opens the "Edit Datasource" pane. Click a cell in your spreadsheet, then select "Edit Datasource" to modify a Period, MO or Metric. |
|
Table Style |
Enables you to change the spreadsheet style with a selection of 5 predefined colors. |
|
Remove Datasource |
Removes all data contained in your spreadsheet. |
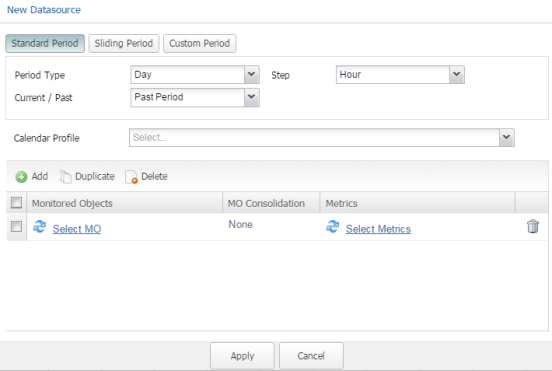
To add a new datasource:
Data Menu
First, select a data period from the three available options. These options are identical to those shown in Dashboard designs feature. Refer to Global Period Pane Description
Then select MOs and Metrics. This panel is identical to Dashboard Design panel. Refer to Widget Operations and Features
By default, the spreadsheet displays 200 rows and 20 columns.
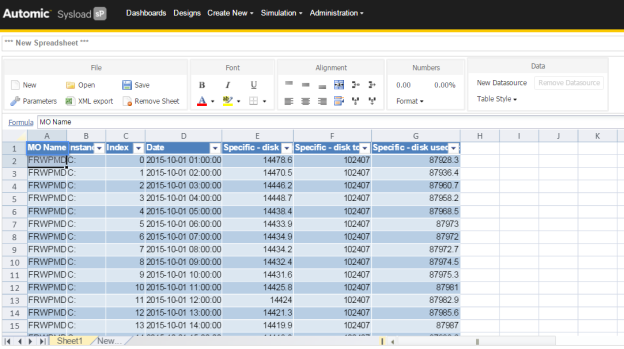
Datasource
The space above the spreadsheet is used to create formulas. The "Formula" link can be used as an external reference to provide you with formula functions.
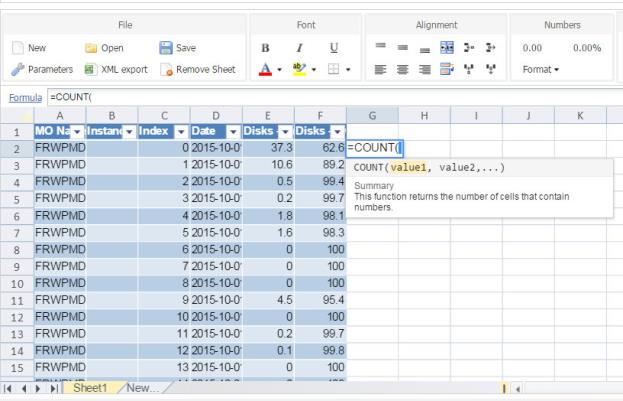
Use known spreadsheet functions without leaving the Portal interface
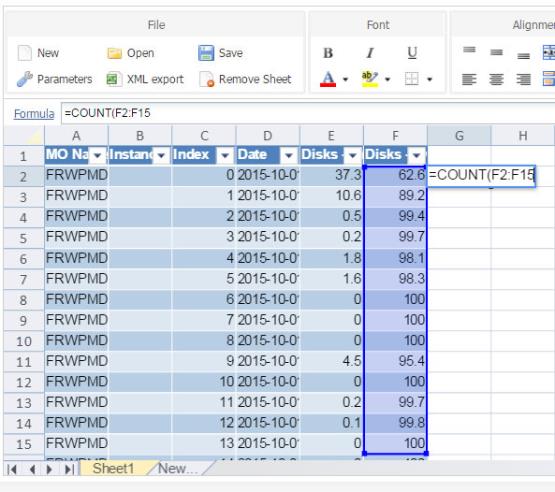
Feature provides same abilities as well-known spreadsheet programs
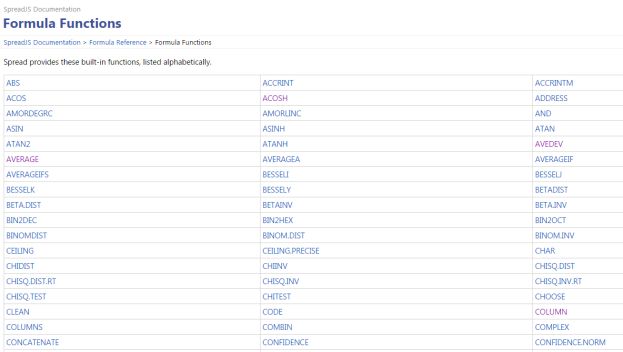
Formula Functions Page
Automic Sysload is not responsible for the content or updating external Webpages.
To undo press CTRL+Z.
There are 2 ways to open an existing Spreadsheet:
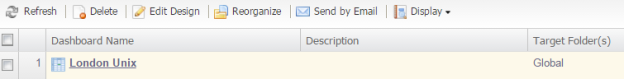
Spreadsheet in dashboard page
We recommend that you create a specific folder for your spreadsheets.
2. From the spreadsheet page, select Open from the displayed ribbon menu.
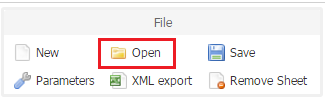
Open spreadsheet from the file menu
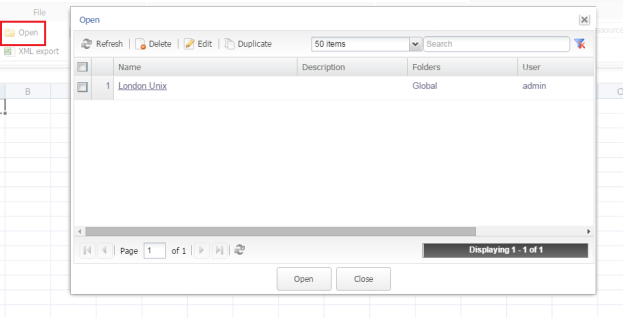
Opening an existing spreadsheet
The pane is displayed when the "Parameters" option is selected on the Spreadsheet toolbar.
|
Item |
Function |
|---|---|
|
Spreadsheet Name |
Spreadsheet name. |
|
Description |
Enables you to add a spreadsheet description. This may relate to the context of the spreadsheet or anything else you might find useful spreadsheet viewer. |
|
Target Folder(s) |
Enables you to select a target folder for your Dashboard from the displayed drop-down list. |
|
Apply |
To save click Apply. |
|
Cancel |
Cancels and closes the "Parameters" pane. |
The "Save" pane operates the same way as the "Parameters", refer to the table above for descriptions. The pane is displayed only when you first "Save" your spreadsheet. If you want to edit your spreadsheet name or target folder you must use the "Parameters" option.
We recommend that you create a specific folder for your spreadsheets using the "Folders" option found in the administration menu.
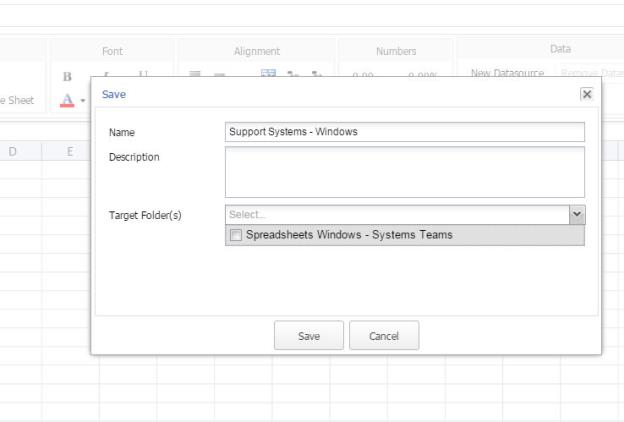
Saving your Spreadsheet for the first time
|
Automic Documentation - Tutorials - Automic Blog - Resources - Training & Services - Automic YouTube Channel - Download Center - Support |
Copyright © 2017 Automic Software GmbH |