Using the Jobstream Optimization Tab
To help you find where you can optimize a jobstream to shorten its runtimes, AAI offers a tool to analyze the critical path history of a jobstream based on its runs over a period of time. This is available to you on the Optimization tab right in the jobstream details for any jobstream. AAI analyzes the jobstream runs over a selected period and comes back with run statistics for every job that ran in the jobstream in that period, focusing on how long each job ran over time and how often each job ran on the critical path. To help you identify the jobs that have the greatest impact on the jobstream run duration, the jobs are ranked by impact and each job's analysis includes a confidence value to indicate how significant the calculations might be. All this information helps you understand the details of the critical path history of the jobstream to know which jobs you need to optimize to shorten the jobstream's runtimes and reliably meet its SLA.
This page includes the following:
Running a New Jobstream Optimization Analysis
You can run an analysis of the most recent runs of any jobstream over a time period and see the current execution trend of the critical path jobs in the jobstream. The AAI analyzes the historical run data and presents the results to you on the Optimization tab of the jobstream details page. Use the steps that follow to enter your analysis parameters for a jobstream and run the critical path analysis:
-
Open the jobstream definition page for the jobstream you want to analyze, and click the Optimization tab.
If an analysis was previously run, you see the analysis results on the tab. Click the Clear Results button in the right of the toolbar to remove those results and enter new analysis parameters.
-
Enter the analysis parameters next to Analyze the Critical Path:
These are presented in a sentence format: Find [search criteria] that have been on the critical path in the last [period]
-
For the [search criteria], select the category of jobs that you want to analyze:
-
Jobs to analyze only the jobs that are not container jobs and ran in the jobstream.
-
Containers to analyze only container jobs that ran in the jobstream.
-
All to analyze both regular and container jobs that ran in the jobstream.
-
-
For the recent [period], select the last 30 Days, 60 Days, or 90 Days.
Your AAI administrator can define which of these fixed periods are available to select in a server parameter.
-
-
Click the Run button.
The results page replaces the current view. While the analysis is running, the framework for the page appears and the shaded data placeholder areas pulsate. When the analysis is complete, the results appear. For information, see Understanding the Results of a Jobstream Optimization Analysis.
Understanding the Results of a Jobstream Optimization Analysis
When you run a critical path analysis on the Optimization tab of a jobstream's details page, you see the results on the same tab page. If you open the Optimization tab and you see a full page of results, these are the results of a previous analysis run. You can examine those results, or start a new analysis. For information, see Running a New Jobstream Optimization Analysis.
The following is an example of the Optimization tab for a jobstream showing the results of a critical path analysis that was run.
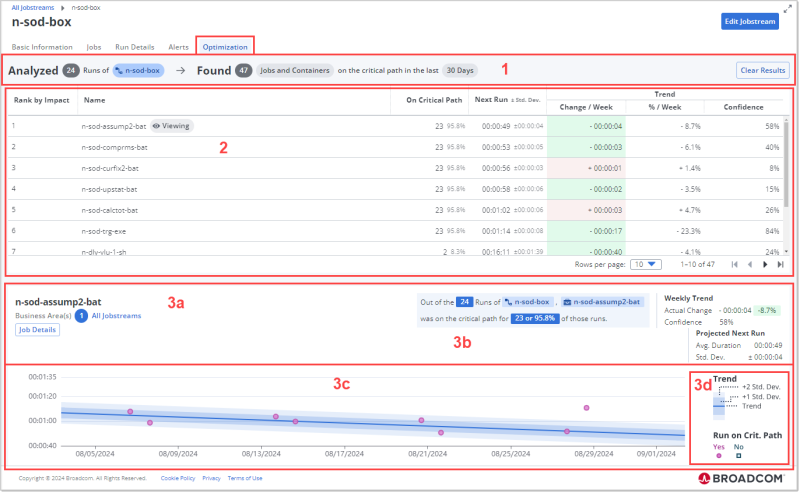
When a critical path analysis for a jobstream has been run, the Optimization tab shows the results of the analysis. The information is presented in several sections, in which each highlights the key data in a bubbles, boxes, or shaded areas, as follows:
-
The title and toolbar, which contains the following three parts (from left to right):
-
Analyzed shows the number of runs in the selected time period that for the jobstream.
-
Found shows the number of regular jobs, container jobs, or both regular and container jobs within the analyzed. The job category and the number of days in the analyzed period are the two run parameters that were selected for the analysis.
-
A Clear Results button to clear the page and return to the page where you can select parameters for a new run.
-
-
A table of all jobs, of the category selected for the analysis, that ran in the jobstream in the selected period. By default the table is sorted by the Rank by Impact of the job. For each job, the analysis results are presented in the following columns:
-
Rank by Impact: This ranking is determined using both the change per week in run times and the confidence rating based on the number of runs and their consistency.
-
Name: The name of the job. A Viewing badge appears next to a job when it is selected and its job details are shown in the bottom panels below the table.
-
On Critical Path: Both how many times when the job ran it was on the critical path of the related jobstream run and the percentage of all its runs within that jobstream that the job was on the critical path.
-
Next Run: The projected run duration of the next run [hh:mm:ss] and the standard deviation of that projected amount (+/- Std Dev) based on the calculated trend.
-
Trend:
-
Change/Week [hh:mm:ss]: The overall change per week in the runtimes.
An increase in runtimes has a positive value and the table cell is shaded in green, and a decrease in runtimes has a negative value and the cell is shaded in light red.
-
%/Week: The percentage of change in the runtimes over a week.
An increase in runtimes has a positive percentage value, and a decrease in runtimes has a negative percentage value.
-
Confidence: The confidence percentage is calculated based on several factors that consider how many runs are included and how consistent the values are. A confidence value of 70% or more shows that the statistics and projections are significantly reliable.
-
By default the table is sorted in descending order of ranking. You can change the sort order and hierarchy by any of the column values an re-size the column widths. However, all the columns are required and cannot be rearranged. For information, see Working with Tables.
-
-
A job detail panel that shows the statistics for the selected job in the table.
The selected job has the Viewing badge next to the job name. As you select different job rows in the table, the Viewing badge moves to that row and the statistics in the job detail panel are immediately refreshed for the currently selected job.
The job details in the panel in the bottom part of the page include the following:
-
The job description, which includes the following:
-
The job name
-
The number and names of the Business Areas of the jobstreams that the job ran in
-
A Job Details button that takes you to the Run History tab of the job's details page. For information, see Job Details - Run History.
-
-
The statistics of the job runs within the current jobstream. These include:
-
A critical path summary for the job that explains, out of the total runs of the jobstream, how many times the job was on the critical path of the run as well as what percentage that is of the job's runs in the jobstream were on the critical path
-
The Weekly Trend values, which are included on the table columns and brought with the other jobs statistics. These include the Actual Change values that show both the Change / Week and the % / Week, and the Confidence percentage, all of which you can see in the table row as well.
-
The statistics for the Projected Next Runs based on the analyzed trend. These include the projected average duration and standard deviation of that projected value.
-
-
A graph showing the run durations of each run of the job within the jobstream during the analyzed period.
-
Each run is depicted by a point on the graph, where a red dot shows that the job was on the critical path during the jobstream run, and a blue square when it was not.
-
A blue trend line that is drawn based on the job runs and excluding outliers. A rising line shows that run times were getting longer over the period, whereas a descending line shows that run times were getting shorter.
-
Shading along the trend line that shows the standard deviation from the trend, with the darker shading that is closer to the trend line depicting a standard deviation of 1 point, and the lighter shading a 2 point standard deviation from the calculated trend.
-
-
A legend for the graph. As this is not data related, it stays identical no matter which job you are examining.
-