The System Overview Dashboard Tab
The System Overview tab is a default Dashboard tab that is pre-defined and pre-loaded for every new user of AAI. This topic gives you a summary of what you find on this tab.
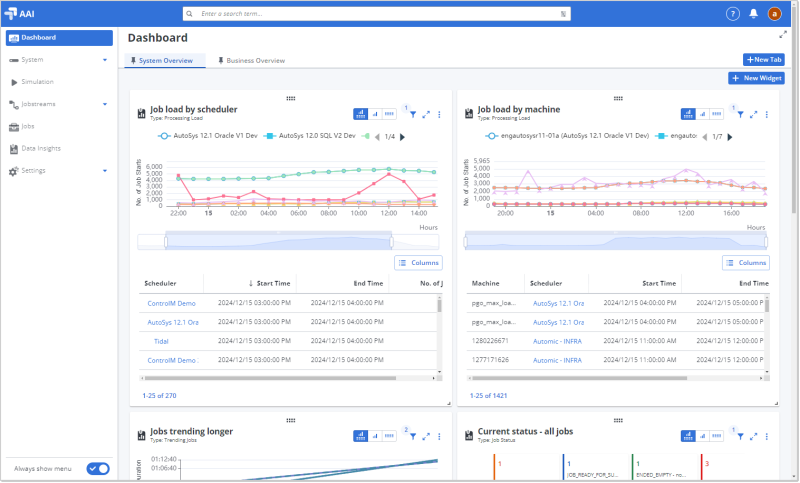
The System Overview tab contains several widgets showing different aspects of your automation environment. As this is pre-defined, when you login to AAI the first time, you get an immediate overview of what is happening in your automation environment in an already compiled and digestible form without having to know anything about working with AAI. Once there, you can start to navigate through the data and discover how AAI depicts and presents the different aspects of your automation business processes.
It is helpful to know that all Dashboard widgets are based on data insights of various types. The data insight types are built on complex data extractions from the rich, real-time and historical AAI databases and designed to present that in the most comprehensive and usable form. Each data insight also has built in filters, configurations, and links to relevant further information that you can use while viewing the data insight. The widgets based on the data insights also have these features, so you can take advantage of those right away on the System Overview tab. For seasoned users, the System Overview has a ready-to-use overview in addition to the Dashboard tabs with widgets for data insights that they created or that were shared with them.
The Widgets on the System Overview Tab
The following are the widgets that you find on the default System Overview tab:
-
Job load by scheduler
This widget shows you scheduler load based on the number of job starts that occurred over the last 24 hours (based on the filter) on each scheduler within a certain time interval . The graph in the top half shows individual lines for each of the busiest schedulers. The table below shows the statistics for each scheduler.
This widget is based on a Processing Load data insight that groups job starts by scheduler. For information, see The Processing Load Data Insight.
-
Job load by machine
This widget shows you machine load based on the number of job starts that occurred over the last 24 hours(based on the filter) on each machine within a certain time interval . The graph in the top half shows individual lines for each of the busiest machines. The table below shows the statistics for each machine.
This widget is based on a Processing Load data insight that groups job starts by machine. For information, see The Processing Load Data Insight.
-
Jobs trending longer
This widget shows you all jobs with run times trending longer over the last 30 days and showing a relatively high statistical validity, which is measured as a 70% Confidence rating. By mousing over the filter icon in the upper right of the widget, you see all filters that have been applied to this view of job performance trends. The lines on the graph and the first rows on the table show the 10 jobs that are trending longest. On the table they are ranked from 1 to 10. Mouse over a line on the graph to see the job name and its trending rate.
This widget is based on a Trending Jobs data insight. For information, see The Trending Jobs Data Insight.
-
Current status - all jobs
This widget shows you the status of all currently running jobs in your system. The tiles in the top half show how many jobs are currently in a specific status. On the tiles, the statuses that are scheduler-dependent are followed by the scheduler name in parentheses. The table below shows statistics for each of the currently running jobs. When you mouse over a tile, a checkbox appears. Click this to filter the table for only the jobs that have that status. You can check more than one tile. Un-check them all to see the full list.
This widget is based on a Job Status data insight. For information, see The Job Status Data Insight.
-
Failed jobs in the last one hour
This widget can show you the completion status of all completed jobs in your system. By default, it filters for only completion statuses that indicate failure of some kind. The tiles in the top half show how many jobs completed with a specific status. On the tiles, the statuses that are scheduler-dependent are followed by the scheduler name in parentheses. The table below shows statistics for each of the related completed job runs. When you mouse over a tile, a checkbox appears. Click this to filter the table for only the tiles that had that completion status. You can check more than one tile. Un-check them all to see the full list.
This widget is based on a Completion Status data insight. For information, see The Completion Status Data Insight.
Tips for Success on the System Overview
Since AAI is a browser-based solution, you will find most navigation fairly intuitive. The following tips can be helpful as you work with the default Dashboard widgets and find your way around the Dashboard and AAI:
-
If you find that you want to return to a previous page, use your browser's back button to step your way back.
-
To keep the current page open when opening a link, you can right-click links and choose to open the destination in a new browser tab or window.
-
To get back to the System Dashboard, click Dashboard at the top of the AAI navigation pane on the left.
-
After opening AAI the first time, any changes that you make to the default Dashboard tabs are retained when you leave the Dashboard and when you logout of AAI.
-
You can modify the widgets on the default Dashboard tabs and you can even delete them if you want. They are intended only as a starting point for you.
Although you do not need to know anything about using AAI to use the System Dashboard, you might not see data on all the widgets. This happens with the related key data structures have not been defined yet, specifically, jobstreams and business areas. This setup is the large task of someone who acts as the business area coordinator for the AAI implementation. For information, see Business Implementation.
See also: