Timeline View Color Key
Jobs and boxes (groups) in the timeline view are rendered with different colors and visual cues to make it easy to understand their relationships to each other. Following is an explanation of the various colors:
| Color | Description |
|---|---|

|
Light Blue: Upstream Jobs NOT on the critical path of the Jobstream. |

|
Red: Jobs that are on the critical path of the Jobstream. |

|
White bar within job run: Indication of the time delay between a job's start and running status (start-to-running delay) |

|
Gold Boxes (Groups): Those that are expanded render a gold square around all enclosed jobs. |

|
Purple: Missing Job where a job run for the missing job participated in the jobstream run. |

|
Blue bar within job: Indication of the average duration. |

|
Red outline with gold center: Boxes (Groups) that are on the critical path of the downstream Target Job. |
|
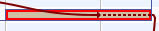
Dashed critical path line: Indication of the part of the container that the critical path travels through when the container is collapsed. |

|
Blue outline: Selected jobs and/or boxes (groups). |

|
Diagonal lines: Jobs predicted to run based on the What If scenario. |

|
Corner triangle: Predicted Duration Indicator occurs when the job or box (group) has a User Supplied Predicted Duration specified. |

|
Blue dotted line: Jobstream average end time. |

|
Red dotted line: Jobstream average late time. |