Analysis Tab - Timeline View
After selecting a run date for a jobstream, the timeline view of the jobstream is displayed in Gantt chart type visualization. All upstream jobs that can affect the successful completion of the downstream Target Job are shown in this view. It is very easy to distinguish the Critical Path leading to the Target Job, as it is differentiated in a number of ways. Further, you can customize the view to analyze the jobstream run.
The Timeline View is divided into three separate panels:
-
Jobstreams List Panel
-
The Upper Level Panel
-
The Jobs List Panel
This page includes the following:
Jobstreams List Panel
The Jobstreams List Panel is located on the left side of the screen in the Analysis Tab view. It lists the jobstreams defined in the Automic Automation Intelligence in two ways:
-
Categorized
-
Alphabetic
Click on the binocular icon button to find a jobstream in the Categorized or Alphabetic tab by name.
The Upper View Panel
The Upper Level Panel of the Analysis Tab offers different sources of additional information about the selected job/jobstream. Depending on the type of jobstream selected, the Upper View can be expanded to display information about machines, resources and datasets (CA7).
Machines
Machines are displayed in Upper View Panel in the Analysis Tab. Automic Automation Intelligence displays machines in two different ways:
-
Job Count View
To display or hide the Machines (Job Count) view, click on the Machines icon, displayed as a black square with a green button, on the toolbar in the Upper View Panel.
The Machines (Job Count) view lists all of the Machines/CA7 Agents that are used by jobs in the jobstream, and shows how many jobs are using those Machines/Agents over the time span of the jobstream run.
Mousing over the graph will produce a tool tip indicating the highest number of concurrent jobs that run on that Machine/Agent while running the selected Jobstream. The peaks and valleys of the graph provide a graphic representation of the number of jobs running on that Machine/Agent at a given time.
-
Load factor
Peak load during the course of the jobstream run
maximum load defined for the machine
-
Load View
To display or hide the Machines (Load) view, click on the wheelbarrow icon on the toolbar in the Upper View Panel.
The Machines (Load) view lists the machines that have a Max Load defined and are associated with a virtual machine in the scheduler.
Mousing over the graph will produce a tool tip indicating the current usage, in terms of:
-
Load factor
-
Peak load during the course of the jobstream run
-
Max Load defined for the machine
Mousing over the graph produces a tool tip with the data for the three criteria listed above. The peaks and valleys of the graph provide a graphic representation of the usage of that machine at a given time.
-
Jobstreams can have both types of Machines, Machines (Job Count) and Machines (Load), associated with them. For CA7 schedulers, only Agents are shown.
Machine/Agent Details
Additional detail about a Machine/Agent can be found in the Upper View Panel by selecting the Machine/Agent and then either clicking the Details button on the Timeline View Toolbar, or by right-clicking while hovering over the Machine/Agent name or graph and then selecting Machine Details.
The Machine Details Dialog has three components:
-
Resource Utilization Graph
-
Machine Tab
-
Job(s) Tab
Machine Details - Resource Utilization Graph
The Machine Details Resource Utilization Graph displays a graphic timeline of the entire jobstream. The Resource Utilization Graph also gives users easy access to Machine/Agent usage based on specific times as indicated by using the slider on the Resource Utilization Graph. Using the Control+Left Arrow (previous) and Control+Right Arrow (next) keys on the keyboard selects the previous and time that the resource utilization changes. More information about the Resource Utilization Graph and its features is discussed in the following sections.
Machine Details - Machine Tab
The detail displayed on the Machine Tab in the Upper View Panel depends upon what type of Machine is selected.
If a Machine/Agent from Machines (Job Count) is selected, the only property displayed, as shown below.
If a machine from the Machines (Load) is selected, three properties are displayed:
- Name
- Parent
- Limit
Machine Details - Job(s) Tab
The jobs tab provides a list of all jobs running on that Machine/Agent during the time in question. There are two options for this feature:
-
Over the entire jobstream
-
During the highlighted span.
With this option, only the selected time span will be highlighted in yellow. The data listed for the jobs will then include only the jobs that ran in the selected span or subset of the entire jobstream.
Depending on the option you select, the Machine detail for Machines (Load) is slightly different from the detail for the Machines (Job Count). Job Name, Start Usage, and End Usage is the information displayed for Machines (Job Count). The information provided for Machines (Load) includes Job Name, Start Usage, End Usage, and Amount.
Another available feature in the Machine Detail dialog is the ability to view a particular time enabling the user to see what was running. Clicking in the Resource Utilization Graph within the Machine Detail dialog gives users the ability to quickly display jobs using the selected Machine. Clicking and dragging the slider along the Resource Utilization Graph displays the jobs that run during the time indicated by the slider. Jobs shown in bold in the detail table are those that are running precisely at the moment of the time indicator.
The list of jobs generated for the specific time is global. The list of jobs is not restricted to just the jobs in that jobstream, but any jobs controlled by that scheduler that ran on that Machine/Agent at that time.
Restricting the jobs list by selecting during highlighted span restricts the number of jobs displayed in the list to those that ran during that span. Selecting this option also restricts the slider in the Resource Utilization Graph to the selected span. The slider is not able to move beyond the selected time. This is true for both types of Machine views.
Resources
When a job utilizes Resources, the Resources icon is attached to the job inside the Gantt Chart View. To view the Resources utilized by the selected jobstream, click on the Resources button, which displays in Automic Automation Intelligence as a tri-colored (red, yellow, and green) square. The Resources shown are global, and are linked to jobs other than those shown in the selected jobstream. The graphic represents not only the usage but the limits of each Resource. Once a job has completed, the representation of the Resource usage goes down accordingly. When a job begins, a corresponding increase is noted in the graphic representation of that Resource.
The current limit represented is the maximum usage for that period of time. Automic Automation Intelligence is currently unable to obtain the correct limits from CA7.
To show a job's dependency on a Resource, click on the job name or on the job icon in the Gantt Chart View. Automic Automation Intelligence will draw a green line connecting the job to the Resource at the earliest time that the Resource is available. Mousing over a Resource reveals the jobs that are utilizing that Resource at the given time and how much of the Resource is being used by each job. The limit and in use is also shown for that particular time. As the mouse moves along the timeline while hovering over a Resource, the information provided will display the information regarding that resource for that time.
Resource Detail
Resource Details over Entire Jobstream run (Jobs Tab)
By default, the Resource Details dialog opens showing the jobs using the Resource over the entire jobstream. The yellow highlighted portion of the Resource shows the period during which the selected job runs. To show the corresponding highlight in the Resources Panel, click on the Show Job Interval in Upper View button on the toolbar.
To show more detail about Resources, access the Resource Details dialog located in the Upper View Panel in the Analysis Tab. It appears as a file folder icon. Or, right-click on the Resource and select Resource Details.
Resource Details during Highlighted Span (Jobs Tab)
To see only the Resource Details during the highlighted span, or during the time the selected job runs, click the radio button labeled during highlighted span. Clicking within the Resource Details dialog on the Resources Utilization Graph activates a slider. This slider can be manipulated to display jobs running during the time selected by the slider. Jobs that are shown in bold face are currently active. The job that is currently selected in the Gantt view is displayed in italics.
Resource Details (Resource Tab)
The Resource Tab shows the name of the resource and the limits for that Resource.
The Resources shown in the Resource Detail dialog are global, and are not restricted to the jobs within the selected jobstream. There may be jobs named in the Resource Detail dialog that are running concurrently within the same Resource. The Resource Utilization Graph will appear similarly within jobstreams that are running concurrently. They will have the same shape, but the scale will be dependent on the jobstream.
Datasets (CA7)
One of the unique features of Automic Automation Intelligence for CA7 is the understanding and visualization of Datasets from within the Gantt view. To expand the top panel, click on the Datasets button, displayed as a gray database icon, in the Upper View Panel in the Analysis Tab. Expanding the Datasets Panel will reveal all of the Datasets that have the potential to influence the execution of the selected jobstream. Only Datasets that trigger other jobs or satisfy an explicit dependency in CA7 are shown in the Gantt view; other Datasets are simply ignored.
Relationships between jobs and Datasets are drawn the same way as relationships between jobs. Clicking on a job in the jobs list will display the relationships that a job has with Datasets and other jobs.
A Dataset that is created by a job will be indicated by a blue line drawn from the job to the Dataset. A job triggered by a Dataset is indicated by a dotted blue line drawn from the Dataset to the job. A dependency satisfied on a job by a Dataset is indicated by a solid blue line drawn from the Dataset to the job in the Timeline View.
Clicking on the Datasets Icon again collapses the Datasets Panel. The Timeline View then displays only the relationships between jobs.
The Jobs List Panel
This screenshot shows the Job List panel:
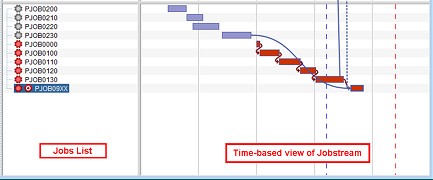
The Jobs List Panel displays the jobs contained in the selected jobstream. Jobs can be selected by the mouse either directly in the timeline or in the list. You can also mouse over any job in the timeline to see the name of that job. Selecting a job highlights the job in the Gantt View. Notice that by default the second-level boxes (groups) will be collapsed. Clicking on the expand icon allows you to expand the boxes (groups), revealing the jobs and/or boxes (groups) within that box (group) and their associated timeline view. If the Show Job Interval in Upper View button is selected, the job interval will be highlighted on the timeline.