Job Details - Average Runs
Every job in AAI is continuously predicted. This means that AAI constantly calculates and predicts how long a job will run using its run history and that this information is always up-to-date. The Average Runs tab provides a wealth of data derived from these calculations. It shows the job aggregates based on its run history:
-
Average run duration
-
Average delays
-
Start and end run times
-
Predicted job run durations
-
Prediction model that is used for each job
-
Graphical representation of the duration of individual job runs
-
Graphical representation of the average job run durations
The information on this page lets you identify trends on the job run duration overtime, potential causes for delays (scheduler overload, suboptimal load distribution, and so on), dependencies on other jobs and details about jobs and jobstreams that are affected by those delays.
This page includes the following:
AAI's Prediction Models
To understand the information provided on this tab you must know the basics about AAI's prediction models (the models that AAI applies to calculate averages and future durations). AAI uses the following prediction models:
-
Moving average
This is AAI's default prediction model. It considers the entire job run history, excluding the outliers, and calculates average durations using this data. AAI uses the resulting average duration values for all its subsequent predictions and calculations.
-
Day of the week
AAI recognizes when jobs do not have very consistent average durations for every day of the week but that show peaks on certain days. When this happens, instead of the moving average method, AAI automatically uses the day of the week prediction model. With this model AAI calculates the job run average durations per day.
AAI chooses which prediction model to use for each job automatically based its available duration data.
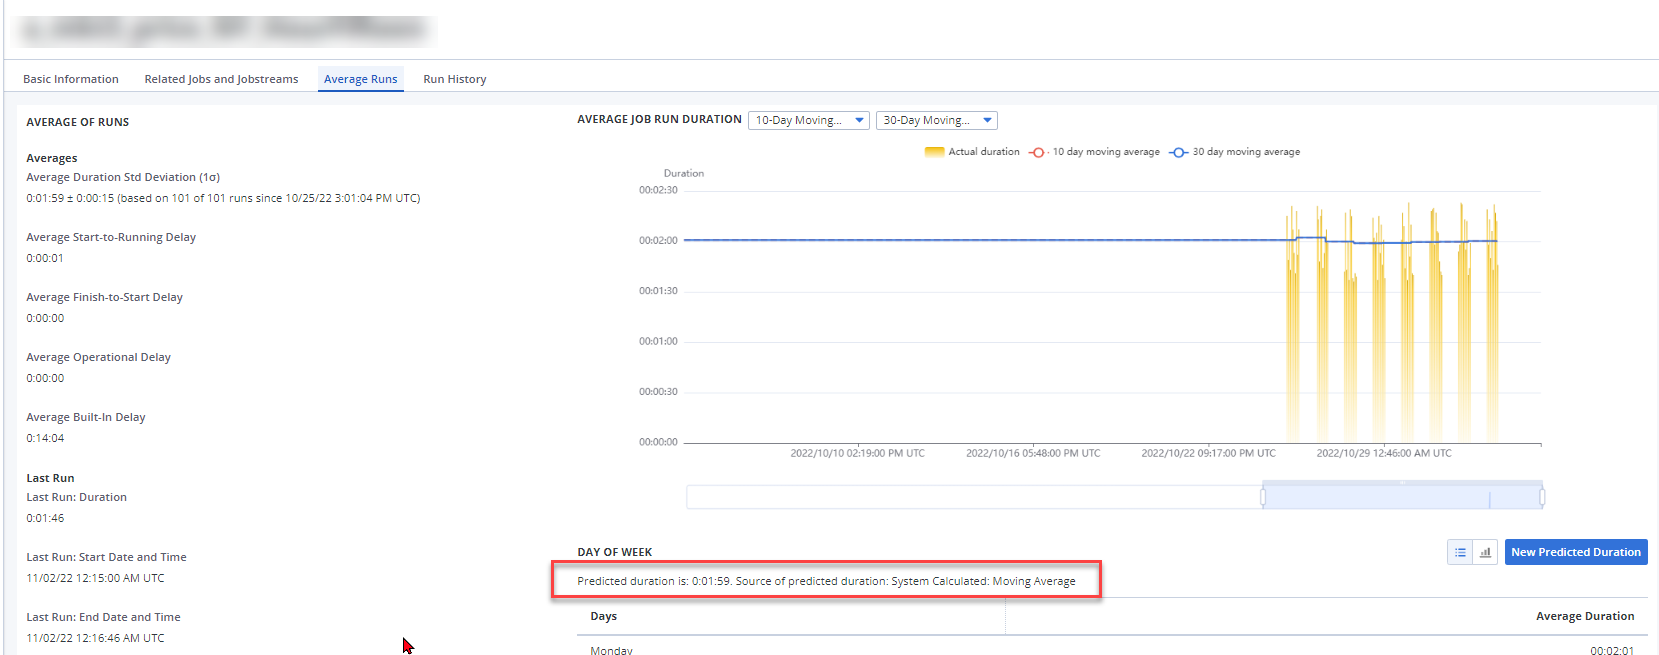
AAI indicates which kind of prediction is being used. You can see it on this tab under DAY OF WEEK (click the image to expand it):
AAI lets you override the automatically selected prediction model. For information about how to do this and about its use cases, see New Predicted Duration.
Average of Runs
The left section of the Average Runs tab provides information about the job run's average duration, delays (if any) and start/end timestamps of its last run. The delays are good indicators that either the scheduler needs optimization or that the job design is flawed and should be corrected. In AAI there are two categories of delays: System delays (start-to-running, finish-to-start delays) and non-system delays (operational delay). They are explained in this list, along with the rest of the fields in this section:
-
Average Duration Standard Deviation
This value indicates the job's average duration along its standard deviation. For example:

Where:
-
0:01:59 is the job run average duration
-
+/- 0:00:15 is the range of deviation from the average
-
based on 101 of 101 runs since MM/TT/YY HH:MM:SS means that all 101 historical runs that are available for this job since the indicated time stamp were considered in the calculation. This information is useful because it tells you how good a metric the average is. Generally, upwards of three weeks worth of data results in a meaningful average.
Distinct outliers are excluded from the calculations. For example, if this job had 10 outliers, this value would read based on 91 of 101 runs.
-
-
Average Start-to-Running Delay
Jobs go through various statuses when they execute. Before it actually runs, a job goes into a start status. The scheduler gathers resources and lines up everything that the job needs to be able to execute. When this is done, the job goes into a running status. This delay measures the time that elapses between the start status and the running status of a job.
This value is a good performance indicator of the scheduler. If this delay is long, this means that the scheduler is working hard and it might indicate an overload.
-
Average Finish-to-Start Delay
Time that elapses between the completion of one job and the start of the next job in the jobstream. As happens with the start-to-running delay, the finish-to-start delay is a good performance indicator of the scheduler. You can use the information provided by these delays to suggest optimizations to the team in charge of the scheduler.
The Processing Load Report provides detailed information about the system delays (start-to-running and finish-to-start). For more information, see Processing Load Report.
Important!System delays that keep growing indicate that it is necessary to reorganize the scheduler and/or redistribute the load. For example, if you always have a peak at certain times of the day, it might be necessary to spread that load over the next few hours or to increase capacity (additional resources, add remote agents, and so forth).
-
Average Operational Delay
Delay that measures the amount of time that the operation team takes to fix an issue in a job. For example, a job fails at 01:00 a.m. and manual intervention is necessary. An operator restarts it at 01:30 a.m. The 30 minutes in between are the operational delay.
This delay is a good indicator of how the operations team is reacting to issues in schedulers. It can serve as a starting point to suggest improvements in the team's procedures, protocols and so forth.
-
Average Built-in Delay
Delay that is caused by the design of the job itself, usually due to semantic errors in their definitions. For example:
-
The job has a hard-coded start time.
-
The job has a reference to another job that no longer exists in the scheduler.
-
The job has references to a calendar that no longer exists, and so forth.
Tip:Hand over the information about these delays to the development team of the corresponding scheduler so that they can redesign the jobs accordingly.
-
-
Last Run
Details on the duration, and start and end times of the most recent run of this job.
Working with the Average Job Run Duration Graphic
The Average Job Run Duration graphic is a visual and interactive representation of the job run moving averages over two different time frames. By default, AAI searches back 90 days of runs to display this data.
Selecting the Time Frame
The two dropdown lists at the top of the graphic let you select two different time frames to calculate the moving averages:
-
Short time frames (5, 10 or 15 days), the default is 5
-
Long time frames (30, 60 or 90 days), the default is 30
For example, if you select 10-Day Moving Average, AAI takes the last 10 days, assembles one data point per day and divides it by 10. If there are no runs on a given day, that data point would be 0. If there are 10 runs that day, the data point would be the average of those 10 runs for that particular day.
Toggling Bars and Lines On/Off
The buttons beneath the dropdown lists let you toggle the bars and the moving average lines on and off.
How the Graphic Shows Changes in Trends
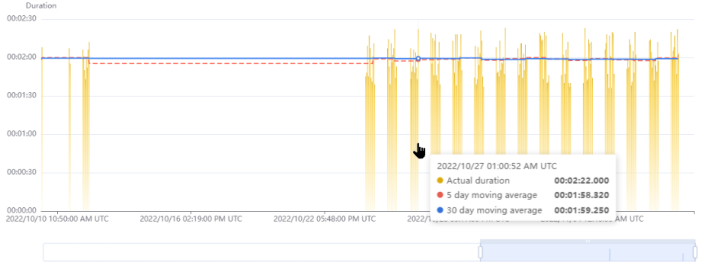
Each yellow bar in the graphic represents a run of the job. The x axis indicates the dates, timestamps and time zone on which the run happened. The y axis indicates the job run duration in hh:mm:ss. The red dotted line represents the short time frame moving average, the blue line represents the long time frame moving average. The combination of these lines lets you identify trends overtime. For example, if you start seeing the short-term average going up relative to the long-term one, you want to investigate why it is taking longer for the job to finish. Could it be due scheduler load? Could it be due to dependencies within the job?
An average over a longer period of time is more reliable indication of the job trend because more data points are used to calculate it.
Hover your mouse over a bar in the graphic to display a legend with the details of that particular run:
Navigating Through the Execution Timeline
Use the slider beneath the graphic to navigate back and forth through the executions timeline:
-
Put your cursor over the bar at the top of the slider until it turns to a double arrow.
-
Click to grab the slider and move it left/right.
Zooming in and Out
Use the slider to zoom in/out in the timeline and display more or less runs in the graphic:
-
Put your cursor over one of the ends of the slider until it turns to a double arrow.
-
Click to grab the end and move it to expand or shorten the slider.
Day of Week Average
For jobs that consistently show specific averages on each day of the week, AAI automatically applies the day of the week prediction model rather than the moving average. If a job has this type of behavior and, therefore, this method is applied, the Day of the Week section displays the average durations in hh:mm:ss per day. Otherwise, this section is empty.
The Table View and Graph View buttons at the top right of the section to select the view let you select how to display these averages.
New Predicted Duration
The New Predicted Duration button allows you to override the job run duration that AAI has automatically predicted. Click it to open the Add Predicted Duration dialog and enter the new predicted duration. You can also enter a description that explains your reasons for modifying the system-calculated duration.
In Expiration Information you can determine whether this modification should be permanent or not.
Examples
-
A job has failed and an operator must restart it. Let's suppose that this fix takes 30 minutes. You add the extra 30 minutes to the system-calculated average duration.
-
You know that you will have a one-off situation where a particular job will need much longer than usual to complete. If you can anticipate that it will take 30 minutes longer
You can plug in those extra 30 minutes into AAI's prediction engine and thus get accurate completion times for the jobs (and consequently, for the jobstreams).
See also: