CDA Monitoring and Diagnostics
As an Administrator you check combined data from different event types to analyze how your CDA system is performing and fix possible issues and bottlenecks.
Event timing metrics (for example, time to calculate the Deployment Descriptor for a given Workflow and Profile) are collected and compared over time to provide meaningful information to the user such as:
- When did the action start slowing down
- How does today's performance compare with yesterday's
- AE time compared to total time
Different event types require different kind of resources, for example: DB and AE. CPU and RAM usage metrics are also logged to provide a better overview of the system load.
This page includes the following:
Events
The following Events can be analyzed:
| Event ID | Event | Resources | Data | AE time (in ms) | Total time (in ms) | Count | Description |
|---|---|---|---|---|---|---|---|
| 0 | Create execution |
|
|
* | Deployment node (Component-Target assignment) | Measures the time needed to create an execution including the Deployment Descriptor generation. | |
| 1 | Start execution |
|
|
* | * | Deployment node (Component-Target assignment) |
Measures the time needed to start an execution by triggering the workflow in the Automation Engine. |
| 2 | Generate Deployment Descriptor |
|
|
* | Deployment node (Component-Target assignment) | Measures the time needed to create the Deployment Descriptor | |
| 3 | Read RM Instances |
|
* | Number of instances. | Measures the time needed to read instances from the RmInstance table. | ||
| 4 | Read Custom Type registry (VARA) |
|
|
* | * | Measures the time needed to read the Custom Type Registry. | |
| 5 | Get Activity List |
|
* | * | Number of activities. | Measures the time needed to send an ActivityList request and get a response. | |
| 6 | Get Agent List |
|
* | * | Number of agents. | Measures the time needed to send an AgentList request and get a response. | |
| 7 | Create Approval |
|
|
* | Measures the time needed to create an approval request. | ||
| 8 | Approve Approval |
|
|
* | Measures the time needed to approve an approval request. | ||
| 9 | Login to AE |
|
|
* | * | Measures the time needed to log into the Automation Engine. | |
| 10 | Read number of waiting background tasks |
|
Waiting tasks. | Measures the time needed to read the number of waiting background tasks from the Tsk table. | |||
| 11 | Process a background task |
|
|
* | * | Measures the time needed to process a background task in the Tsk table. |
The performance monitor logs the metrics directly to the database tables (which can be identified by the prefix PL_*).
A summary of the logged data is provided in the Performance Events view of the Administration perspective.
To Enable Performance Data Logging
You can define which kinds of events/processes should be logged in the customer.config file (Automic\Release.Manager\WebUI\customer.config). See Configuring the Web Application - Customer.Config.
To Set Up IIS for CPU and RAM Usage Status Logging
In order to use/enable RAM and CPU logging, the IIS Application Pool that is used to run CDA (OneInstaller: CDA_APP) must be added to the "Performance Monitor Users" OS user group.
Note: This will log system-wide CPU and RAM usage in percentage in general, not just the part used by CDA.
- Open the Windows local User Management console: run lusrmgr.msc
- Select and open the Performance Monitor Users group.
- Click Add to display the Add user dialog.
- Open the location selection dialog and select the current server.
- Add the user IIS APPPOOL\CDA_APP (this exact name is required).
- Click Check Names to verify the user name.
- Click OK to close the Select User dialog.
- Click OK the close the Group dialog.
Alternatively, you can run the following command on PowerShell:
net localgroup "Performance Monitor Users" "IIS APPPOOL\CDA_APP" /add
To Export Collected Performance Data
You can export the collected performance data from the Performance Events view in the Administration perspective.
Analyzing CDA Performance Data
You can use any tool to parse, display and visualize the exported data in JSON format.
The following examples show how to use Microsoft Excel 2016 to read and display performance data from the JSON file and directly from the REST endpoint.
Important! If you are using Microsoft Excel 2010 or 2013, the Microsoft Power Query for Excel add-in must be installed to display the data. The add-in tab is displayed on the ribbon.
To Read Performance Data from a JSON file
- Open Excel.
- Go to Data > New Query > From File > From Text
- In the File Selection dialog, change the file extension to All Files, select the downloaded .json file and click Import.
- Open the Transform tab and click To Table.
- In the To Table dialog, select None as delimiter and click OK.
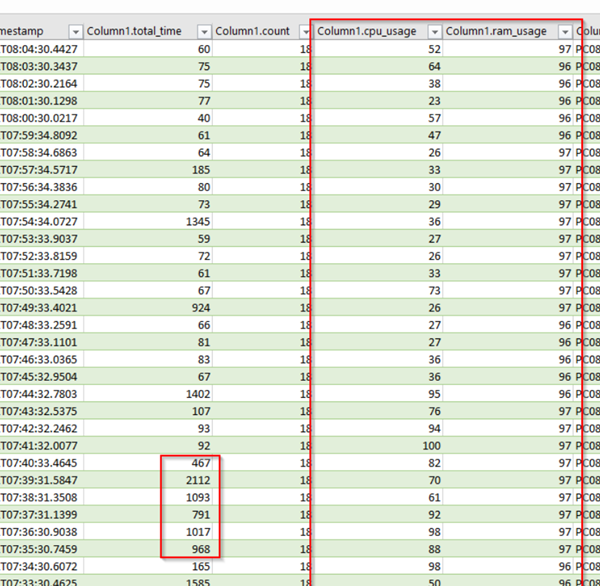
- Click the Expand button on Column1, select all columns, and click OK.
- Click Close & Load.
To Read Performance Data from a REST Endpoint
- Open Excel.
- Go to Data > New Query > From Other Sources > From Web.
- In the From Web dialog, select Advance.
- Enter the URL to the REST endpoint. For example: https://araserver/ara/api/system/v1/performance/events (replace araserver/ara by your real ARA server URL and filters). You can filter events by types, start and end date
- Select Basic authorization and add the following header: <base64 encode of username:password>. You can use any base64 encode tool or online tool.
- Open the Transform tab and click To Table.
- In the To Table dialog select None as delimiter and click OK.
- Click the Expand button on Column1, select all columns, and click OK.
- Click Close & Load.
Visualizing Data
Since each event consumes different types of resources, you can combine data from different events to have a better overview of your overall system performance and compare it with the values of the reference system. Your production system should perform better than the reference system, which is a single box setup for AE, AWI and CDA.
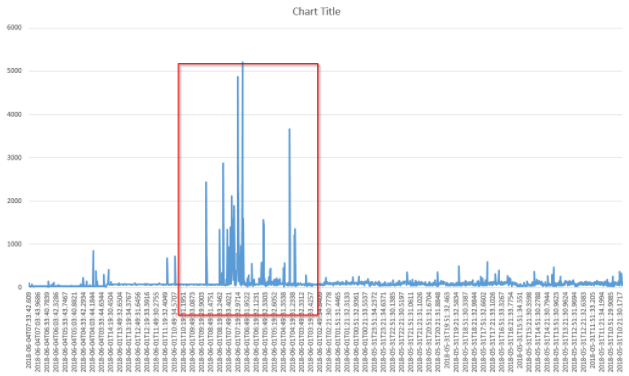
The following example shows how to display the Get Agent List event results as a line chart
To Visualize Data
- In the Column1.event_type column select Get Agent List.
Note: You can add extra filters to other columns as needed.
- Create a new sheet and add a new line chart.
- Right-click the chart and select Select Data.
- Select the timestamp and total_time columns.
- Click OK. The chart is displayed.
Understanding Data
You can also calculate the Average Total Time and Standard Deviation to easily compare your system data with the reference performance data.
Important! The table filter cannot be used to display the Average and Standard Deviation. You can specify a filter from the REST endpoint using the start and types query parameters instead.
Unstable systems have a high Standard Deviation. This usually happens when the system is under-performing or when the system resources are running low (CPU, RAM).
Note: Click the images to expand them.
A high average value indicates a low system performance. One or more of the following issues may be the cause:
| Issue | Reason | Action |
|---|---|---|
| Local system is slow | CPU is slow. |
|
| Other applications consume too much CPU power on your node. | Run the AE exclusively on your nodes. | |
| The system is under memory pressure. | Add memory / reduce memory consumption. | |
| The virus scanner slows down I/O's. | Do not run the virus scanner on you production node. | |
| The database is slow. | The connection to the database is slow. |
|
| Database transactions are slow. |
|
Minimum Requirements
Get Agent List
- 10 agents
- Average Total time: < 80ms
- Standard deviation: < 30ms
Read Custom Type registry
- Average Total time: < 90ms
- Standard deviation: < 50ms
Generate Deployment Descriptor
- DemoApp (comes with OneInstaller, default deploy workflow) on 10 nodes
- Average Total time: < 700ms
- Standard deviation: < 90ms
Create Execution
- DemoApp (comes with OneInstaller, Component workflows are empty) on 10 nodes.
- Average Total time: < 750ms
- Standard deviation: < 110ms
Start Execution
- DemoApp (comes with OneInstaller, Component workflows are empty) on 10 nodes
- Average Total time: < 250ms
See also: