Grouped Table Chart Widget
The Grouped Table Chart widget shows multiple attribute values or counts rendered in a table.
The Grouped Table Chart allows you to categorize information by attribute and then display the data values that you want in a table.
- Appearance
- Title: title of the widget (displayed in the upper part of the widget)
If no title is defined, the default title Grouped Table Chart is used.
- Title: title of the widget (displayed in the upper part of the widget)
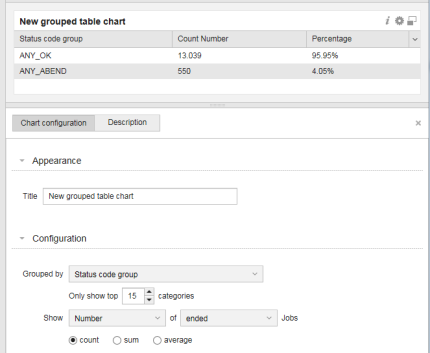
- Configuration
- Grouped by: select how you want to categorize the data (by Agent type, hour of day, status code, and so on).
- Select the maximum number of displayed categories in the picker.
- Show. You can select the following values:
- Count: total number of records by sub-category.
The Number option in the Show drop-down list is selected automatically.
In the Jobs drop-down list you can filter the status of the data to be displayed: ended or started.
Example: the Agent Type category contains the following sub-categories: Windows & UNIX. If you select the count value and the started status from the Show drop-down list, the total number of existing Windows and UNIX agents are displayed:
Agent Type Count Number WINDOWS 11.040 UNIX 357
Sum: Total sum of a certain value of a sub-category.
- Select how you want to show the sum value: by runtime (actual time) or by ERT (estimated runtime).
In the Jobs drop-down list you can filter the status of the data to be displayed: ended or started.
Example: The 11040 Windows Agents and 357 UNIX Agents sum the following run time:
Agent Type Sum Run time WINDOWS 6.135.990 UNIX 15.204
Average: average value of an attribute that is listed by sub-category.
- Select how you want to show the average value: by runtime (actual time) or by ERT (estimated runtime).
In the Jobs drop-down list you can filter the status of the data to be displayed: ended or started.
Example: Average run time of all Windows and Linux agents:
Agent Type Average Run time WINDOWS 556,07 UNIX 109,27
- Count: total number of records by sub-category.
-
Description: Optionally, you can specify a description to identify the data that is displayed.
Setting Widget Specific Timeframe
You can set a specific local timeframe directly in a widget. When this feature is activated, all data contained in the widget is specific to your set timeframe. All other widgets in your dashboard are unaffected by individual widget changes.
