
|
Clients |

System Overview |
Agents |

|
 Automation Engine/Server
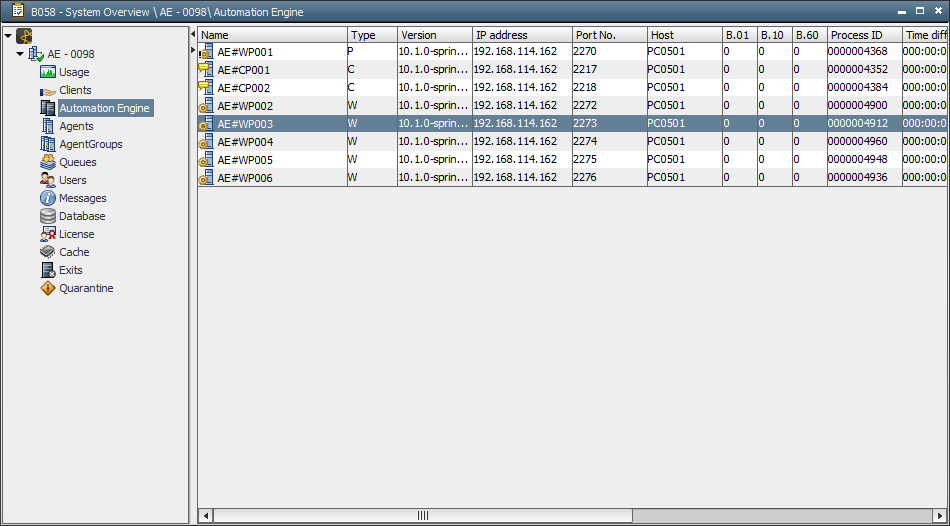
This category lists all server processes. Currently inactive processes are displayed with a white symbol. You can open the statistics and the current report of a process via the context menu. You can also end individual server processes.
|
Column |
Description |
|---|---|
|
Name |
Server process name including the patch level. This name is a combination of the system name, #, process type and the consecutive 3-digit process type number. |
|
Type |
C ... Communication Process |
|
Version |
Server process version including the patch level. |
|
IP address |
TCP/IP address of the server process. |
|
Port No. |
Server process port number. |
|
Host |
Name of the computer on which the server process is running. |
|
B.01 |
Percentage of server process utilization during the last minute. |
|
B.10 |
Percentage of server process utilization during the last 10 minutes. |
|
B.60 |
Percentage of server process utilization during the last 60 minutes. |
|
Process ID |
Process identification number of the server process. |
|
Time difference |
Time difference between the computer on which the server process is running and the AE system. |
|
Server time |
Date and time of the computer on which the server process is running. |
|
Connections |
This column shows the number of external connections. Internal connections between communication processes and work processes are shown in the ServiceManager. Number of connections to the communication process (such as UserInterfaces and agents).Connections to work processes are exempted. For work processes: The value is always "0". |
| Role |
Server role that the work process assumes. Possible values: "O" and "R" "O" - Output Each role is only assigned once. Therefore, a work process does not necessarily assume a role. Communication processes cannot assume Server roles. |
| Net Area |
Name of the server processes' net area. By default, this value complies with the name of the AE system. WPs always run within the same net area. |
|
Column |
Description |
|---|---|
|
Statistics or report |
Calls the statistics or the last report. |
|
Edit |
Opens the related Server-process object. |
| Start |
Starts the selected server process via a ServiceManager. You can only use this option if a ServiceManager is available that can be used to start the server process. You must also enter the ServiceManager settings in the Server object either manually or by using the command "Refresh ServiceManager Scan". |
|
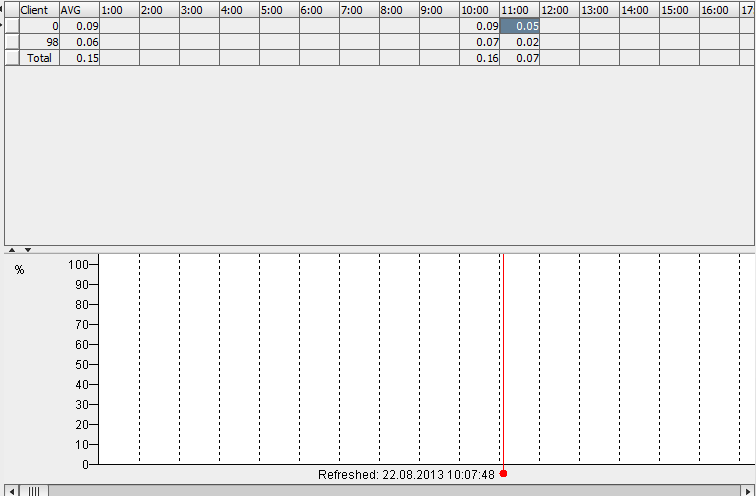
Usage Chart |
Shows the workload of the particular server process |
|
Change Logging |
Causes the log file to be changed. In the properties, you can specify that the log changes automatically. Note that changing the log file of a particular work process implies that the log file of all other work processes are also changed. |
|
Change Server mode to DWP / Change Server mode to WP |
Changes the work-process mode from WP to DWP and vice versa (see also WP_MIN_NUMBER) WP ... Work Process You cannot change a work process to a dialog process, if it performs a Server role(check in the Role column). |
| Change Server mode to PWP / Change Server mode to WP |
Changes the work-process mode from WP to PWP and vice versa. WP ... Work Process You cannot change a work process to a primary work process, if it performs a Server role (check in the Role column). |
|
Close |
Closes the server process immediately regardless of tasks that might be running. |
| Workload | Opens the search (message analysis) or statistical overview (message statistics of buffered Server messages). This menu item is only available for work processes (WP, PWP or DWP). |
|
Properties |
Calls the "Properties" dialog (see below). |
| Refresh ServiceManager Scan |
Refreshes the ServiceManager's connection settings for the selected server processes. You must specify these settings if you start the server processes via the System Overview or the script element MODIFY_SYSTEM by using a ServiceManager. You can use the Server object's Attributes tab in order to show and manually edit these settings. This scan is automatically made when the server processes start for the first time. It can happen that the service name that has been entered in the Server object does no longer comply with the related service name in the ServiceManager. In this case, Automic recommends running the "Refresh ServiceManager Scan" command or entering the relevant values manually. |
|
Refresh |
Refreshes the view. |
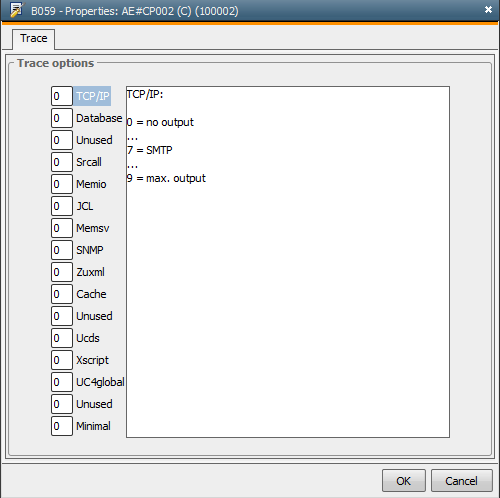
The Properties command in the context menu opens a dialog in which you can specify various settings. In the first tab, you can set and delete trace options. In doing so, you can log the behavior of the Automation Engine even in exceptional cases. You do not have to shut down the Server if you start tracing but your system's performance can decrease as a result thereof because traces can create a log of data. Automic recommends setting trace options only in close cooperation with Automic Support.
In the trace options section, you can specify numerical values for the individual options. A short description of the values is shown in the right window section.You can also specify more than one trace option.
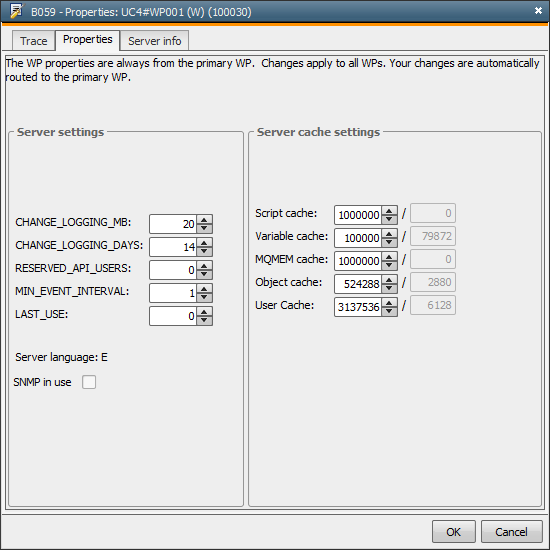
In the Properties tab, you can specify the general settings for the server process and the values for the Server input buffers. The window shows two parts. In the left part, you can specify a maximum value. The right part shows the current usage (see also: Cache tab).
|
Column |
Description |
|---|---|
|
Server settings |
Values for Server settings are read from the variable UC_SYSTEM_SETTINGS. New values that are specified in this UserInterface are only valid until the AE system is cold booted. The administrator can make permanent modifications in the variable UC_SYSTEM_SETTINGS. |
|
CHANGE_LOGGING_MB |
Size in MB at which the log file should be changed. Allowed values: "1" - "32767" You can also prompt the log file to be changed by using the script element CHANGE_LOGGING. |
|
CHANGE_LOGGING_DAYS |
Number of days after which the log file should be changed. Allowed values: "1" - "32767" You can also prompt the log file to be changed by using the script element CHANGE_LOGGING. |
|
RESERVED_API_USERS |
Number of user licenses that are reserved for accesses via the CallAPI. Allowed values: "0" - "32767" |
|
MIN_EVENT_INTERVAL |
Minimum interval (in minutes) in which events should be executed. An event can also include a value that lies below this minimum interval. In this case, the system uses the interval that is specified in the event. |
|
LAST_USE |
Time delay (in minutes) after which the usage counter of objects will be refreshed (Header tab). |
|
Server language |
Primary language in which the login is made. This value is retrieved from the Server's INI file. |
|
SNMP in use |
Displays whether SNMP is used. You can also specify this setting in the Server's INI file. |
|
Server cache settings |
Format: User-defined value / Current value |
|
Script cache |
Maximum size of the input buffer (Bytes) for scripts. |
|
Var cache |
Maximum size of the input buffer (Bytes) for variables. |
|
MQMEM cache |
Maximum size of the input buffer (Bytes) for the message queues. |
|
Object cache |
Maximum size of the input buffer (Bytes) for objects. |
|
User cache |
Maximum size of the input buffer (Bytes) for users. |
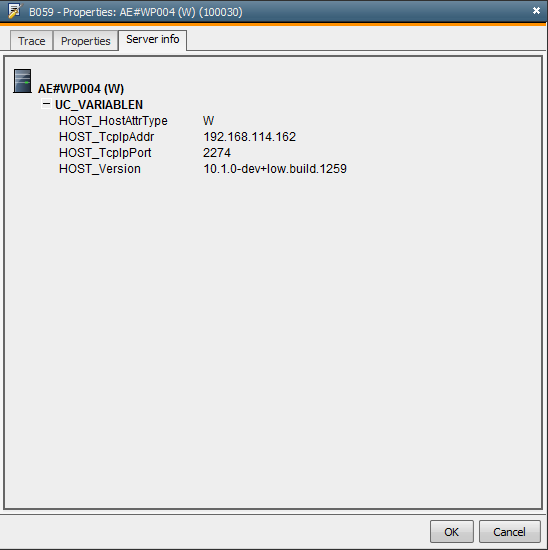
The third tab shows specific information about the server process.
You can also open a usage chart for the individual processes. The window that opens is structured in the same way as the window that shows the workload of all processes.
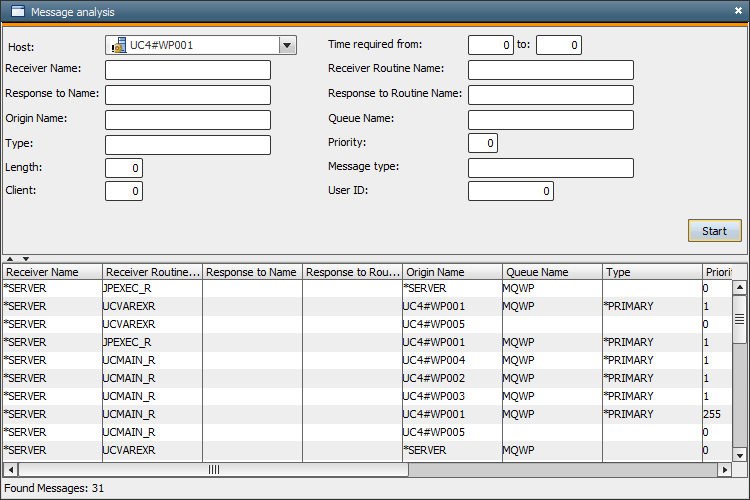
In this dialog, you can select specific Server messages by specifying criteria. Note that you can only search for messages that are currently buffered. The number of messages that are buffered depends on the setting MQA_BACK_COUNT in the variable UC_SYSTEM_SETTINGS.
You cannot use wildcards for searching messages. Automic recommends listing all messages before you start a search (default setting) and then specifying the values for the fields that should be searched. Each search field comes along with a corresponding column.
You can either open the message statistics for one specific work process (statistics process option) or for all process that comply with the type (WP, DWP or PWP) of the selected work process (statistics type option).
The statistics include the time that it took to send the message (time from sending to receiving it), the Server load and the number of messages. The values are shown for all messages of a particular type (Type column) of each selected work process and as a total sum of all listed types (--TOTAL--).
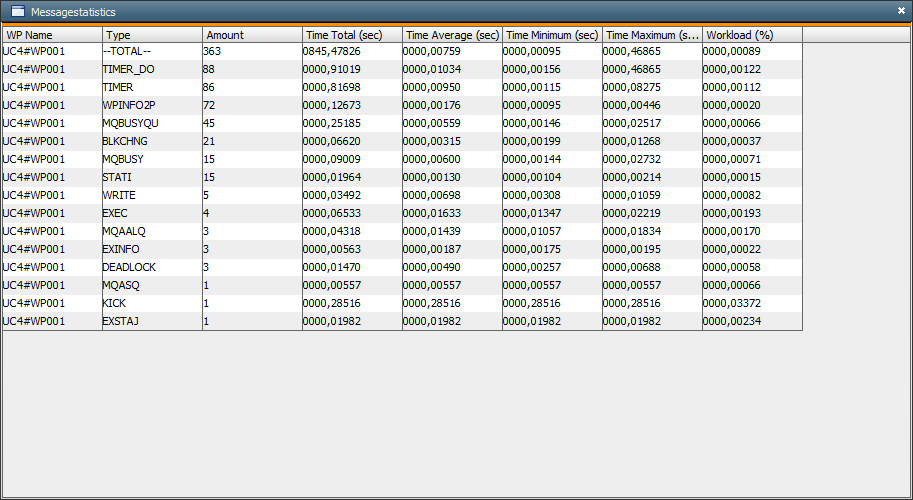
"Time Total" refers to the period of time that was required to process the messages. "Time Minimum" shows the shortest time and "Time Maximum" the maximum time that was required to send a message. The average sending time is shown in a separate column.
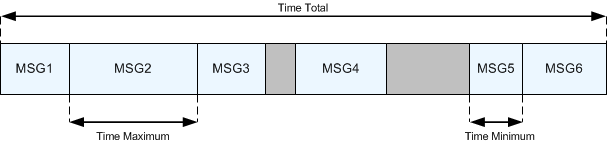
For example:
The following example shows the processing of 6 Server messages. The gray blocks symbolize the time periods during which no messages were sent. The total time ranges from sending the first message until the last selected message has been received.
See also: