 Processes & Usage
This Processes & Usage sub-page displays information about the currently existing work processes (WPs) in a system. You can retrieve information about them and execute basic commands.
This topic provides information on the following:
- Overview
- Working with the Processes List
- Opening a process
- General Usage: Viewing statistical data on the processes
- Viewing the details of a process
- Opening the Execution data and the Reports
- Changing the logging
- Starting/Quitting a process
- Changing the server mode
- Updating the Service Manager link
- Setting the Advanced Options
- Trace Flags Section
- Additional Trace Options Section
- Server Setting Section
- Server Cache Setting Section
Where to find the page:
- Open the Administration perspective.
- In the Navigation pane on the left, find the Automation Engine Management page.
- Click its tab to expand its sub-entries, find the Processes & Usage sub-page.
You can open the execution data and the current report of a process as well as access all available functions via the context menu that is displayed when you right-click a process. Additionally, the toolbar provides shortcuts to the most important functions.
Currently inactive processes are grayed out.
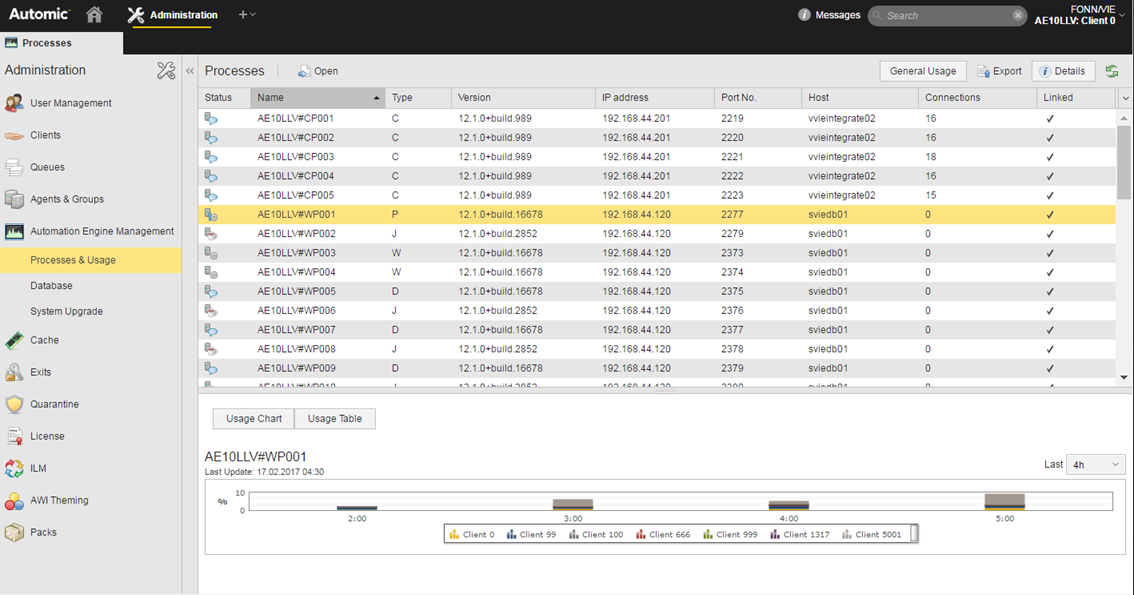
Working with the Processes List
|
Column |
Description |
|---|---|
| Status * | |
|
Name* |
Server process name including the patch level. This name is a combination of the system name, #, process type and the consecutive 3-digit process type number. |
|
Type* |
C ... Communication Process For details seeServer Processes. |
|
Version* |
Server process version including the patch level. |
|
IP address* |
TCP/IP address of the server process. |
|
Port No.* |
Server process port number. |
|
Host* |
Name of the computer on which the server process is running. |
|
B.01 |
Percentage of server process utilization during the last minute. |
|
B.10 |
Percentage of server process utilization during the last 10 minutes. |
|
B.60 |
Percentage of server process utilization during the last 60 minutes. |
|
Process ID |
Process identification number of the server process. |
|
Time difference |
Time difference between the computer on which the server process is running and the AE system. |
|
Server time |
Date and time of the computer on which the server process is running. |
|
Connections* |
This column shows the number of external connections. Internal connections between communication processes and work processes are shown in the ServiceManager. Number of connections to the communication process (such as the Automic Web Interfaces and agents). Connections to work processes are exempted. For work processes: The value is always "0". |
| Role |
Server role that the work process assumes. Possible values: "O" and "R" "O" - Output Each role is only assigned once. Therefore, a work process does not necessarily assume a role. Communication processes cannot assume Server roles. |
| Linked* | |
| Net Area |
Name of the server processes' net area. Details: Net Areas in the Automation Engine By default, this value complies with the name of the AE system. WPs always run within the same net area. |
* These columns are not displayed by default. To be able to see them, you must expand the list of additional columns by clicking the arrow (  ) to the right of the header row. ) to the right of the header row. |
|
In the toolbar, the buttons Export and Refresh are available by default. These buttons allow you to refresh the content of the table and export it as a CSV file.
Select one or more processes and right-click and pick Open or click the Open button on the toolbar. The Process definition pages are displayed, where you can change the parameters, provided you have the necessary rights.
General Usage: Statistical Data on the Processes
The panel at the bottom of the Processes page provides additional statistical records on the process. Click the General Usage button on the toolbar to open it. If you have previously selected a process from the list, this pane displays the information that is specific to that process. Otherwise, it displays the workload of all Automation Engine work process.
The information can be displayed in two different ways:
-
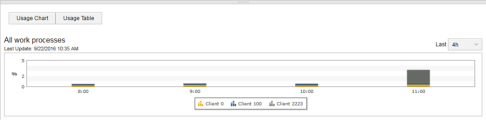
Usage Chart
Click this button to see the data displayed as chart columns, by client. The x-axis shows the time of the workload data, the y-axis the percentage of workload at a given point in time.
From the Last dropdown list select the time frame for which you want to display the usage data.
Click the client icons at the bottom of the chart to show/hide that particular client's data.
-
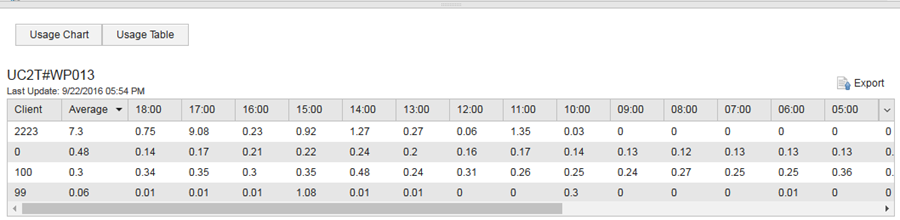
Usage Table
Click this button to see the workload of one or all processes in percentages.
Each column stands for a certain hour. Client data is displayed in lines, one line per client (hourly values and average value).
If necessary, you can change the sort order of the columns in the table by clicking the column header.


Viewing the Details of a Process
Click  to open a pane on the right hand side of the page that displays the variables used in the selected process.
Opening the Execution Data and the Report
Select one or more processes and right-click to select Executions. This calls the Executions - Statistics for Agents page, where information on past executions of the processes are displayed.
Likewise, select a process and right-click to select Open Report. This opens the Reports window with the last Reports for Servers and Agents
The Automation Engine logs large amounts of information. To be able to handle your log files easily, you can define system-wide settings that break the information to be logged in smaller chunks and thus produce also smaller log files.
For example, you can determine the maximum size of the log file; or you can specify the number of days that may elapse before a new file starts. You do so in the UC_SYSTEM_SETTINGS variable using the CHANGE_LOGGING_DAYS and CHANGE_LOGGING_MB keys. See UC_SYSTEM_SETTINGS - System-Wide Settings.
You can also change the log settings via the Automic Web Interface. For this purpose, right-click one or more records and select Initiate Log Rotation; this causes a new log file to be written. A dialog prompts you to confirm your action.
Changing the log file of a particular work process implies that the log files of all other work processes are also changed.
Select one or more inactive processes and right-click to select Start Process. This activates it.
Select one or more inactive processes and right-click to select Stop Process. This stops the process immediately, regardless of tasks that might be running.
WP stands for Work Process, DWP for Dialog Process, PWP for Primary Work Process.
With the Change Server mode to WP/DWP you change the work-process mode from WP to DWP and vice versa (see also WP_MIN_NUMBER).
You cannot change a work process to a dialog process if it performs a Server role (check in the Role column).
Likewise, with the Change Server mode to WP/PWP command you change the work-process mode from WP to PWP and vice versa.
You cannot change a work process to a primary work process if it performs a Server role (check in the Role column).
Updating the Service Manager Link
Select one or more process and right-click to select Update Service Manager Link. This refreshes the connection settings to the Service Manager for the selected server process.
You must specify these settings if you start the server processes via the Administration perspective or the script element MODIFY_SYSTEM by using a ServiceManager. You can use the Server object's Attributes Page in order to show and manually edit these settings.
This scan is automatically made when the server processes start for the first time. It can happen that the service name defined in the Server object does no longer comply with the related service name in the ServiceManager. In this case, Automic recommends running the Verify connection to Service Manager command or entering the relevant values manually.
Select a process and right-click to select Advanced Options. This opens a dialog where you can specify trace flags and additional settings.
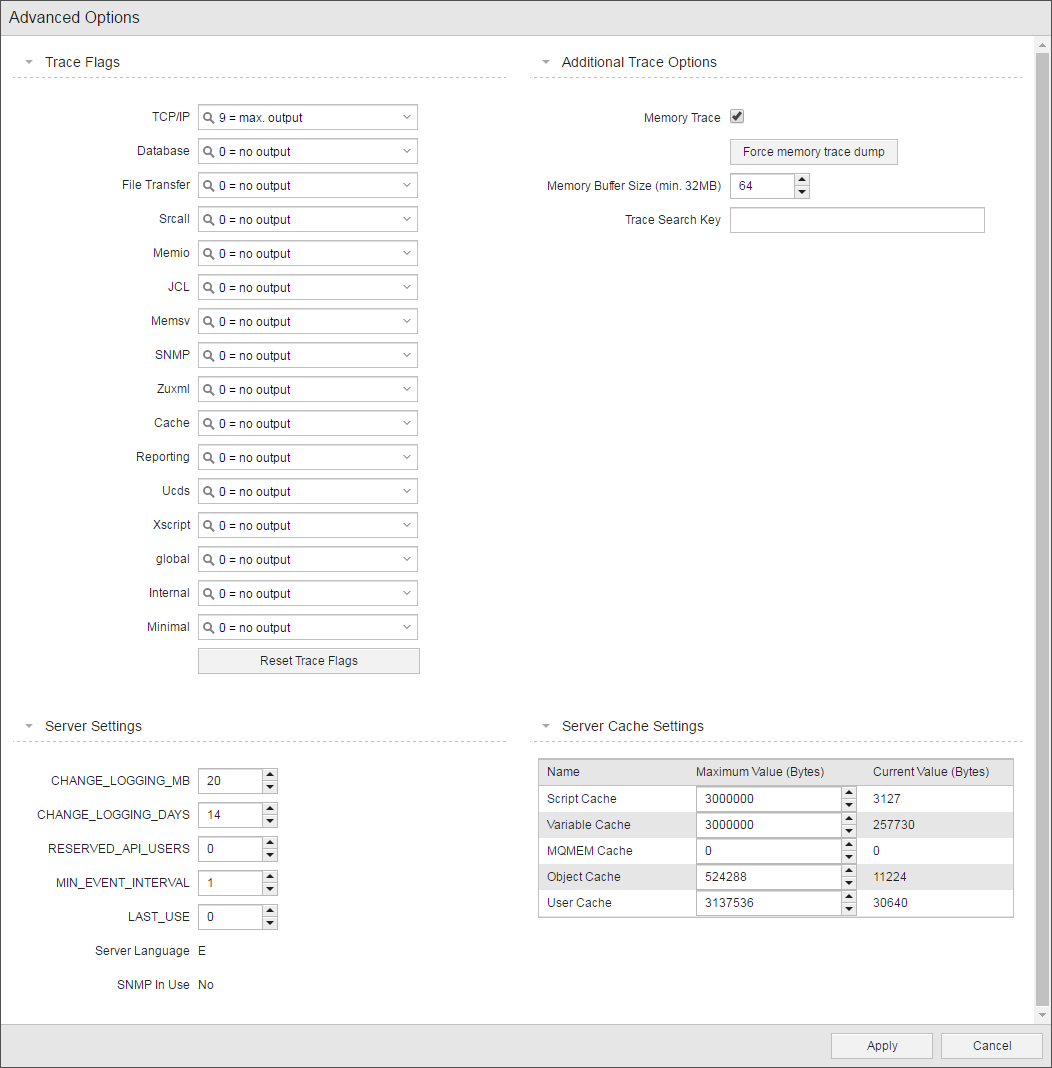
In doing so, you can log the behavior of the Automation Engine even in exceptional cases. You do not have to shut down the Server if you start tracing but your system's performance can decrease as a result thereof because traces can create a log of data. There are several trace flags, Automic recommends setting trace options only in close cooperation with Automic Support.
In the Trace Flags section, you set the trace level for a number of process activities. The trace values are 0–9 to indicate the level of detail collected, but values can be different for some processes. Tracing is disabled when the trace value is 0 (zero).
In the trace options section, you can specify numerical values for the individual options. A short description of the values is shown to the right of the number in the each drop-down list. You can also specify more than one trace option.
Additional Trace Options Section
In the Additional Trace Options section for WP processes, you specify the following options for trace.
| Option | Description |
|---|---|
| Memory Trace | You can use this option in combination with the Trace Search Key. The trace messages will be saved to a memory buffer until the search string is found, at which time tracing stops and the messages are written to one trace file on the disk. Without this option, trace files are written directly to the disk, as one or more files, depending on the Max. Trace Size setting. |
| Memory Buffer Size |
The maximum trace size influences the size of the trace files that are written to the disk of the agent's host. How it works depends on whether the Trace Memory option is enabled:
In all cases, the real size of the trace file tends to be larger than the maximum size defined because the trace component finishes writing the message or code that it is logging when the size limit is reached. Some script statements can be extremely long, so the file size will be noticeable larger than the limit set. Important to understand is that the purpose of the Max. Trace Size is to limit the space used in memory. The file representation that is then saved on the disk can be much bigger. For example, if you are using memory tracing, the file will be much bigger, because the trace data is written to the memory buffer in binary form but when the buffer is flushed onto the disk, the trace file is written in hexadecimal form, which explodes the file size. If you set the Max. Trace Size to 0 (zero) without memory tracing, this means that the trace file size is unlimited. However, with memory tracing set, the trace size cannot be lower than the default of 32MB. So, if you enter a value less than that, the system automatically treats it as if it were 32MB. Regardless of the trace settings, if the agent crashes then tracing also stops. The last record will not be written. When the agent starts again, all trace options will be reset to the defaults that are defined in the agent's INI file. |
| Trace Search Key | You can enter a text string, such as a specific error message, that signals the end of tracing. When the tracing component encounters this string, it finishes writing the current message and then it stops tracing and resets all trace options to "0" (zero). You use this to help you focus on the area where the problem occurred and to manage disk space by preventing excessive tracing. |
In the Server Setting section for WP processes, you can specify the general settings for the server process and the values for the Server input buffers.
Values for Server settings are read from the variable UC_SYSTEM_SETTINGS. New values that are specified in this dialog are only valid until the Automation Engine system is cold booted. The administrator can make permanent modifications in the variable UC_SYSTEM_SETTINGS.
|
Option |
Description |
|---|---|
|
CHANGE_LOGGING_MB |
Size in MB at which the log file should be changed. Allowed values: "1" - "32767" You can also prompt the log file to be changed by using the script element CHANGE_LOGGING. |
|
CHANGE_LOGGING_DAYS |
Number of days after which the log file should be changed. Allowed values: "1" - "32767" You can also prompt the log file to be changed by using the script element CHANGE_LOGGING. |
|
RESERVED_API_USERS |
Number of user licenses that are reserved for accesses via the CallAPI. Allowed values: "0" - "32767" |
|
MIN_EVENT_INTERVAL |
Minimum interval (in minutes) in which events should be executed. An Event Object (EVNT) can also include a value that lies below this minimum interval. In this case, the system uses the interval that is specified in the event. |
|
LAST_USE |
Time delay (in minutes) after which the usage counter of objects will be refreshed (Header tab). |
|
Server language |
Primary language in which the login is made. This value is retrieved from the Server's INI file. |
|
SNMP in use |
Displays whether SNMP is used. You can also specify this setting in the Server's INI file. |
In the Server Cache Setting section for WP processes, you can specify cache settings. The table includes an editable Maximum Value column and an read-only Current Value column.
|
Option |
Description |
|---|---|
|
Script cache |
Maximum size of the input buffer (Bytes) for scripts. |
|
Var cache |
Maximum size of the input buffer (Bytes) for variables. |
|
MQSRVcache |
Maximum size of the input buffer (Bytes) for the message queues. |
|
Object cache |
Maximum size of the input buffer (Bytes) for objects. |
|
User cache |
Maximum size of the input buffer (Bytes) for users. |
See also: