Creating Dynamic Charts using EXEC VARA
A VARA to Chart widget is an Analytics dashboard widget. The widget lets you create charts using analyzed data in a VARA object. VARA to Chart widgets work with static and dynamic VARA Objects. Design a one-off dashboard or a dynamic dashboard that can be routinely referenced.
The VARA to Chart use case presented uses an EXEC VARA object. This specific use case is based on a five-day weather forecast using a REST API and script. Although this example is based on an EXEC VARA object, it can be applied to other Dynamic VARA objects.
More Information:
This page includes the following:
What Will You Learn?
- How to create charts using dynamic VARA objects
- How to use VARA.EXEC with some scripting to pass a list of values using a REST job (in our case weather forecasts)
Note: This use case is not an in-depth reference for creating a WEBSERVICE Job of REST. See: Getting a List of Users via REST and Storing the List in a VARA Object
Prerequisites
- Access to a REST API
- Good knowledge of how to create VARA objects in AE
- Good knowledge of how to create AE Objects (Jobs and Connections)
- Good scripting knowledge
- A new or an existing dashboard to add VARA to Chart widgets
Note: If you want to share your dashboard, the end user will need to login to view the VARA objects, even if you have selected Allow Public Access to this Dashboard.
Use Case Objective
- To view a chart that displays a five-day weather forecast, using the minimum and maximum temperature of a city
Used Objects
- CONN.REST.OPENWEATHER
A Connection object - VARA.EXEC.GET_WEATHER
An executable VARA object - JOBS.WEBSERVICEREST.REST_GET_WEATHER
A Job object
Create the Connection Object
Create a WEBSERVICE - REST connection object CONN.REST.OPENWEATHER.
-
In the General section, specify the URL Endpoint. Authentication is not required, a specific API key is associated with our user login.
-
In the Resources section, the forecast and weather are added to the resources used to create a GET request.
-
Define the APPID (key) and the units in the Query Parameters.

Create the VARA Object
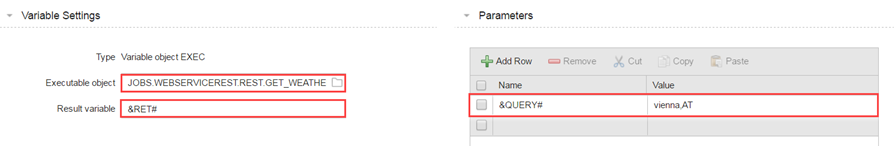
Create an EXEC VARA object and name it: VARA.EXEC.GET_WEATHER.
-
In the Variable Settings section, define the query and its value in the Parameters section. Define Vienna as it is the city that is used in this use case.
-
The Executable object is the RA Web Service REST Agent Job JOBS.WEBSERVICEREST.REST_GET_WEATHER.
-
Set the Result variable to point to &RET#to publish the output.
Create the Job Object
Create a WEBSERVICE - REST job object and name it: JOBS.WEBSERVICEREST.REST_GET_WEATHER.
Define the following parameters in the Job:
General
Using the Connection drop-down list, select the CONN.REST.OPENWEATHER object. The REST connection parameters are defined in this section. In the Computed URL Endpoint text area, copy the URL endpoint. The URL should also include the API key, a reference to the query, and the unit measurement.
Request
Define a GET request, using the forecast resource.

Response
The GET request is returned in the JSON format. The JSON file contains various data concerning the weather forecast, but we only require specific data. We are interested in the following data:
- Date
- Current temperature
- Maximum temperature
- Minimum temperature
The output (Result that is shown in the example) is displayed in sequential order. All successive "temp" values that are presented in the JSON are parsed, then incremented, to form the required list.
Example: This example is based on the test result of TEMP#. The following window displays the temp value 13.52.

The following window displays the corresponding value parsed.

Post Process
As previously mentioned, we want our results be presented sequentially and therefore each successive date or forecast should be incremented to form a list. We can script this in the following way:
-
The first line is always a header line (Date, Temp, Max temp, Min temp).
-
We then iterate and add our data (dates, current, maximum, and minimum temperature).
-
We return the saved data sequence with SAVE_PROCESS().
-
The process is then saved directly in the object that is used for VARA.EXEC.
To return a list of dates and forecast values we used the following script:

In the VARA.EXEC.GET_WEATHER, ensure that the Result variable points to &RET#.

Execute the Job
After you have set up the required objects, execute the job and start to create our VARA chart.
Display a VARA to Chart in a Dashboard
Add a dashboard on the homepage. You will then create the widget in the dashboard. For more information, see Creating Dashboards and Adding Widgets.
-
Click the green Add Widget button from the dashboard toolbar.
-
Select the Analytics tab, then select a VARA to Chart widget.
-
A VARA to Chart widget is created. Click Configure Widget.
-
In the data source section using the VARA drop-down list, select the appropriate VARA object. In this use case, for each chart select: VARA.EXEC.GET_WEATHER.
Configure the Widget
See Vara to Chart Widget for details on all the configuration options for this widget.
Multi-series Chart
To include all client logins and unique logins, select the Multi series chart option.
-
Click the Multi series option button, and the multi-series data-mapping pane is displayed.
-
Add the additional values (using the green plus button) and customize each value header.

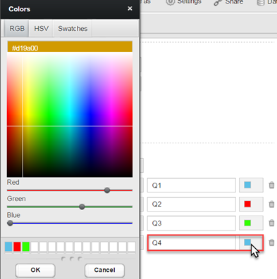
Add Color
When you have finished mapping values, associate each individual value to a color using the color button.
Configure the Chart
Click the Chart Configuration tab to set display options.
The chart, after configuration:

Add a Chart Description (Optional)
The chart Description tab lets you add further information regarding the chart.
Useful Links