Creating VARA to Grid Charts
A VARA to Grid widget is an Analytics dashboard widget. As a dashboard designer, it can help you create a colored grid on data that is accessed by a static VARA object. Grids can be used to monitor indicators that are relevant to your business: key performance objectives, service-level agreements (SLAs), or any other key monitoring tasks.
Notes:
- VARA to Grid widgets work with static VARA Objects only
For information regarding the VARA to Grid widget description, see: VARA to Grid Widget
This page includes the following:
What Will You Learn?
- How to create a dashboard to track business objectives
- How to create a single grid using a VARA object
- How to create a dashboard using a VARA object
Note: If you want to share your dashboard, the end user will need to login to view the VARA objects, even if you have selected Allow Public Access to this Dashboard.
Prerequisites
- Some knowledge of how to create VARA objects in AE
- At least one VARA object to create your widgets
- A new or an existing dashboard to add VARA to Grid widgets
Use Case Objective
The infrastructure team has asked you to create an Analytics dashboard to help them monitor server memory thresholds. To keep inline with your company SLAs, the team have asked you to use the following monitor thresholds as guidelines:
- Server thresholds above 80 percent are considered to be overloaded
- Server thresholds between 51 - 80 percent are considered to be normal
- Server thresholds below 50 percent are considered to be running well
Getting Started
Ensure that you have a VARA object available to create a chart. In this use case, a VARA that shows server availability is used.
Create a Dashboard and Widget
- Create a dashboard and name it
For further information, see: Creating Dashboards and Adding Widgets - Click the green Add Widget button from the dashboard toolbar
- Select the Analytics tab, then select a VARA to Grid widget and click Add
- A new VARA to Grid widget is created. Click Configure Widget to configure the widget
Create a Chart
-
In the Data Source tab, use the VARA drop-down list to select your VARA to Grid object. The VARA object data is automatically displayed in a grid in the top panel and the right-side panel.
If your selected VARA contains multiple value columns, you can select a specific column using the Value drop-down list. For example, Value 1 - 5 may contain data regarding multiple servers across multiple geographies. The default is set to Value 1.
Note: In the preview table, values in the cells that have not been selected are dimmed.
In the following example, the VARA object contains data that is related to agents that monitor servers:
-
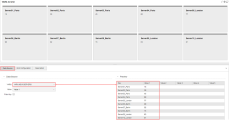
The Filter Key check box is used to filter the VARA object Key column. The filter key lets you use basic logical operators such as: equals, contains, ends with, and starts with.
This feature is useful if a VARA object contains a varied amount of data, but you only use a subset. You can also use the same VARA object to create many widgets, using different sets of data to compare or organize your dashboard.
In the following example the Filter Key check box is used to filter servers that contain the word Berlin: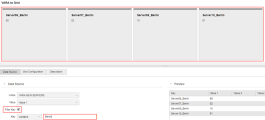
-
Click the Grid Configuration tab. This tab contains two sections: Grid Configuration and Color Mapping.
-
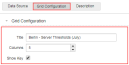
In the Grid Configuration section:
- Enter your grid name in the Title box.
- In the Columns box, set the number of columns to display in your grid. The default is set to five.
- Check the Show Key check box to display the VARA keys column in your grid. Checked by default.
The following example shows the Title, Columns and Show Key set in the Grid Configuration:
-
In the Color Mapping section, choose the type of mapping you want to use. For more information, see VARA to Grid Widget:
- Numeric
- Text
The following example shows thresholds that are mapped to their color: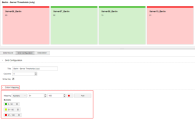
-
(Optional) Click the Descriptions tab to enter a grid description.


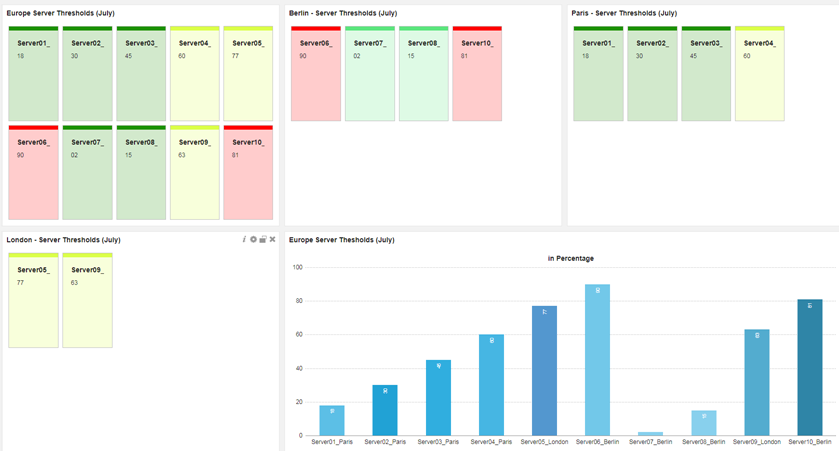
The following example shows our final dashboard with all server thresholds assigned. The first grid on the left displays the entire VARA object data. The other three grids Berlin, Paris, and London are data subsets of the same VARA object. The displayed chart was added using the VARA to Chart feature. See: Creating charts using VARA Objects .