Telemetry - Usage Data
This section of the documentation explains telemetry data collection, transmission to Broadcom, licensed metrics calculation, and alternative reporting methods in case automatic telemetry data collection is not supported.
This page includes the following:
What is Telemetry?
Telemetry is a built-in feature of Automic Automation that collects and transmits product usage and system configuration data to Broadcom. The collected data enables Broadcom to analyze product usage patterns, assess customer requirements, and prioritize enhancements for widely used features and supported platforms.
Broadcom's Commitment to Data Privacy
We are committed to protecting your data and privacy. Telemetry does not collect any personally identifiable information (PII) or sensitive information. Broadcom does not collect Personally Identifiable Information (PII, as legally defined) covered under GDPR. For additional information about how your data is collected and used, read our Privacy Policy.
Telemetry Data Collected by Automic Automation, Automic SaaS and Continuous Delivery Automation
This section details the types of data collected by Automic Automation (including Automic Automation for Hybrid Cloud and Automic Automation AI Edition), Automic SaaS and Continuous Delivery Automation telemetry.
What Data We Collect
The collected telemetry data is securely transmitted to Broadcom and includes information such as the number of executions.
To clarify its purpose, telemetry data is grouped into three high-level categories:
-
Provided by Customer: (Optional) Information identifying your company for licensing purposes, if it is explicitly configured in Client 0 in the Telemetry Configuration section of the Administration perspective.
-
Product & Environment Data: Information that identifies the specific product version and system configuration you are using.
-
Usage Metrics: Quantitative data points related to job executions, nodes, agents, usage analytics, and other metrics that correspond to your license entitlements.
Data Transmitted by the Telemetry
The following table describes the usage data that your product sends to Broadcom.
|
Name (Data Attribute) |
Category |
Description |
|---|---|---|
|
Enterprise site ID (site_id) |
Provided by Customer |
The unique Site ID for your company, as listed on your license agreement and the Broadcom Support portal. |
|
Internal identifier (chargeback_id) |
Provided by Customer |
An optional, non-PII identifier for your business unit, cost center, or department to assist with internal chargebacks. |
|
Domain (domain_name) |
Provided by Customer |
Your company's domain name, for example broadcom.com. |
|
PLA flag (pla_enabled) |
Provided by Customer |
A true/false value indicating if the installation is part of a new or planned usage under a Portfolio License Agreement (PLA). |
|
Instance ID (instance_id) |
Product & Environment Data |
An internally generated unique identifier for each instance of the product. |
|
Product name (product_name) |
Product & Environment Data |
The product name, such as AAHC (short forAutomic Automation Hybrid Cloud) |
|
Product SKU (product_sku) |
Product & Environment Data |
The product identifier for the server, for example, AUTCLD990 |
|
Product description (sku_description) |
Product & Environment Data |
The name of the licensed product as specified in the SPD Program Name, for example, Automic Automation Hybrid Cloud |
|
Product version (product_version) |
Product & Environment Data |
The version number of the installed product. |
|
Collection date (date_collected) |
Usage Metrics |
The date on which the usage data was captured (format: yyyy-mm-dd). |
|
Number of application nodes (maximum_active_tech_nodes) |
Usage Metrics |
The total number of active technology nodes. |
|
Number of application nodes (maximum_active_app_nodes) |
Usage Metrics |
The total number of active application nodes. |
|
Number of mainframe/midrange nodes (maximum_active_mainframe _nodes) |
Usage Metrics |
The total number of active mainframe and/or midrange nodes. |
|
Cloud executions as nodes (cloud_executions_as_nodes) |
Usage Metrics |
The total number of cloud executions recorded as nodes. |
|
HA Cluster (high_availability_cluster) |
Product & Environment Data |
Whether an additional Automation Engine is available for High Availability purposes. |
|
Sum of successful job executions (aggregate_number_of_executions) |
Usage Metrics |
The cumulative total of successful job executions for the full calendar month. |
|
Deployment targets (number_of_deployment_targets) |
Usage Metrics |
The total number of deployment targets. |
|
Avaloq Agent (avaloq_royalty_nodes) |
Usage Metrics |
The number of licensed Avaloq Agents per server. |
|
BS2000 Agent (BS2000_royalty_nodes) |
Usage Metrics |
The number of licensed BS2000 Agents per server. |
|
Usage (monthly_usage) |
Usage Metrics |
The sum of the maximum actual usage in the most recent full month, covering nodes, agents, successful job executions, and other relevant instances corresponding to the licensed product. |
How Licensed Metrics Are Calculated
The licensed metrics are calculated differently depending on your license entitlements and the specific product and system configuration in use:
-
Automic Automation for Hybrid Cloud: Sends the total amount of successful job executions. This is the default for customers on the execution-based license metric and is reported using aggregate_number_of_executions.
-
Automic Automation AI Edition: Sends system configuration information, including the number of instances in use and whether the systems run as a High Availability cluster, as well as the sum of technology nodes, application nodes, and mainframe/midrange nodes.
-
Automic SaaS: Sends the total amount of successful job executions.
-
Continuous Delivery Automation: Sends system configuration information, including the number of instances in use and whether the systems run as a High Availability cluster, as well as the maximum number of deployment targets.
Successful Job Executions Metric
This metric is a cumulative total of all successful job runs over the entire calendar month.
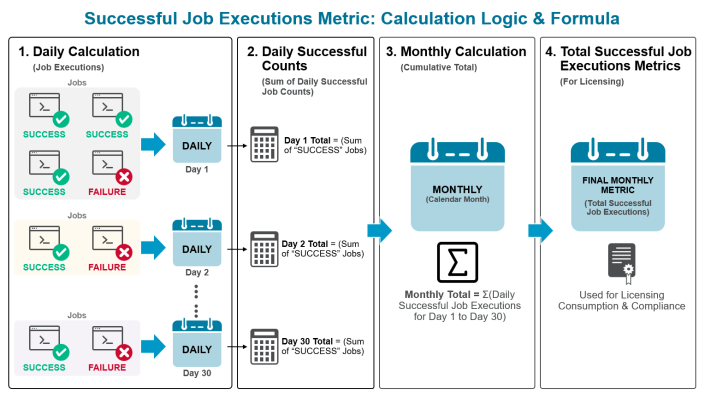
This flowchart illustrates the step-by-step process for calculating the Successful Job Executions Metric on a monthly basis.
Explanation of the Flowchart
-
DAILY CALCULATION (Filter & Count): The process begins with a stream of all job executions for all Jobs (JOBS) and File Transfers (JOBF). The system checks the status of each job.
-
If the status is a Success, meaning the task ended with status OK (code 1900 and 1904), the job is counted, and the daily total is incremented.
-
If the status is an Failure, the job is ignored for this specific metric.
-
-
DAILY SUCCESSFUL COUNTS (Collection): This stage represents the collection of final counts for each day of the month. For example, you will have a separate total for Day 1, Day 2, and so on, up to the last day of the month (Day N).
-
MONTHLY AGGREGATION (Summation Formula): At the end of the month, all the daily successful counts are added together. The formula used is a summation (Σ) of all daily values:
-
Monthly Metric = Σ (Day 1 + Day 2 + ... + Day N)
-
-
FINAL METRIC: The result of the summation is the Total Successful Job Executions (Monthly), which is the single number used for licensing and reporting purposes.
Accessing your Usage Data
As a system administrator, you can configure telemetry to generate your own usage data for the last full month and export detailed information per node (SKU) using the Telemetry feature in the Automic Web Interface. These reports include the same metrics sent to Broadcom, allowing you to view and audit your usage data locally.
The Telemetry section in the Administration perspective is available only in Client 0 and consists of the Configuration and Usage Data pages.
Note: Only users with the Access to the metrics endpoint of Automation REST API AWI privilege can view the Usage Data page.
To view your data locally, do the following:
-
Log into Client 0.
-
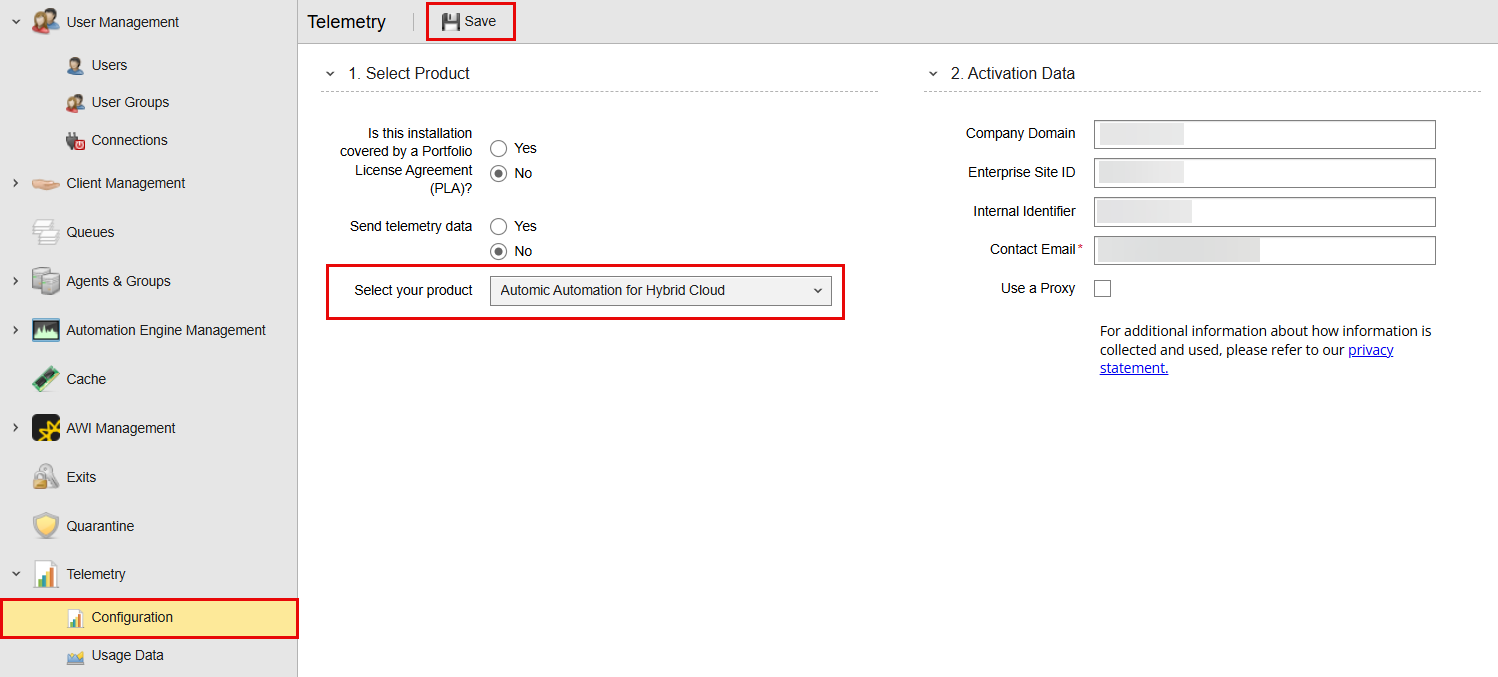
In the Administration perspective click Telemetry. The Configuration page opens automatically.
-
Select your product. This corresponds to the licensed consumption model. For local data viewing, only the product selection is relevant.
-
Automic Automation for Hybrid Cloud
-
Automic SaaS
-
Continuous Delivery Automation
-
(LEGACY) Automic Automation
-
(LEGACY) Automic Automation AI Edition
-
(LEGACY) Automic Intelligent Remediation
-
(LEGACY) Automic Service Orchestration
-
(LEGACY) Automic Workload Automation
-
(LEGACY) Automic Workload Automation - Task Edition
-
-
Save your changes.
This information is also reflected in the UC_TELEMETRY_SETTINGS variable, see UC_TELEMETRY_SETTINGS - Telemetry Configuration.
After saving your changes, navigate to the Usage Data page to access the corresponding information.
Usage Data List
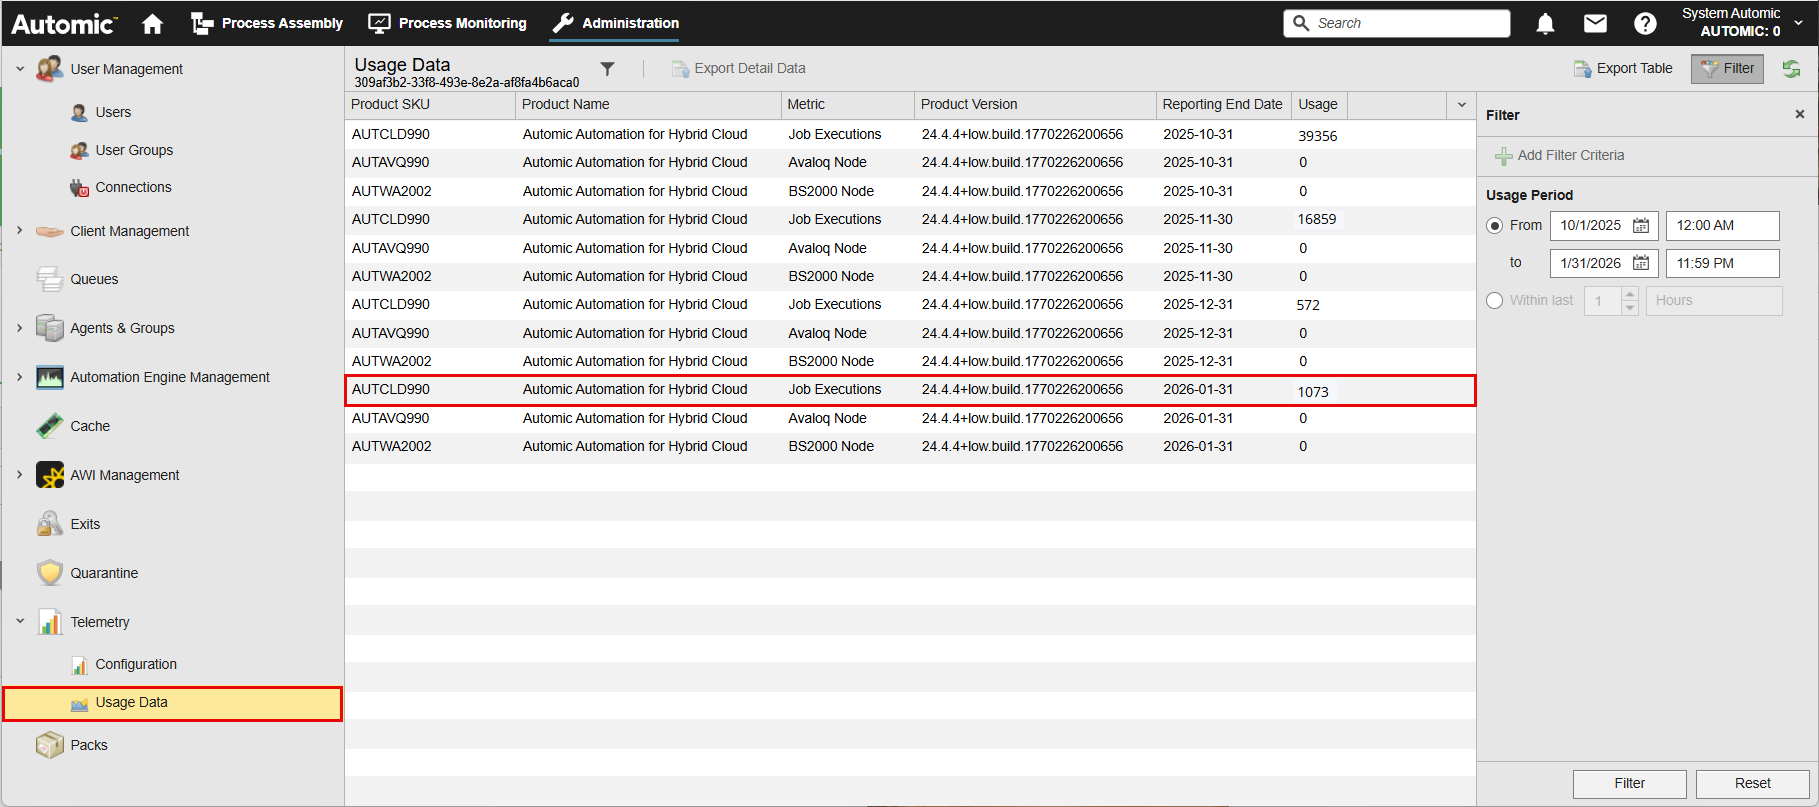
By default, the Usage Data list displays the telemetry usage data for the last full month for the product you selected in the telemetry Configuration page.
The following columns are displayed by default:
-
Product SKU
-
Product Name
-
Metric (SKU description)
-
Product Version
-
Reporting End Date
-
Usage
The Usage Data list also allows you to view detailed information about the elements that make up your instance's technology nodes, application nodes, mainframe nodes, or orchestrated systems. To access the detailed list, click the relevant Product SKU to expand the list.
Filtering Usage Data
You can use the Filter function in the Usage Data page to define a specific usage period. Click Filter to open the Filter pane and click it again to close it.
When you open the filter, the following filter options are available:
-
From/to: Defines the start and end dates for the usage data you want to display.
Important! Telemetry usage data is available only for past full months. Be sure to select the first and last days of the month. You do not need to adjust the time values — the filter automatically includes the full day. When you press Reset, the filter returns to its default state.
To use this option:
-
Activate From/to and select the desired month(s):
-
Click the calendar icon to open the calendar view.
-
Use the arrows at the top of the calendar to navigate to the first day of the chosen month, then select the date.
-
Repeat the process to define the last day of the month.
-
-
Within last: Looks back a specified number of months from the most recent complete month. Partial current months are not included. The end date is always the end of the last full month.
To use this option:
-
Activate Within last and specify the time frame.
-
Use the spin buttons to select the number of Months.
The selected start and end dates are displayed below this option.
Because telemetry data is available only for full months, only the Months setting is relevant for this filter option.
-
Click Filter at the bottom of the pane to apply your criteria, or click Reset to restore the previous filter settings.
Exporting Usage Data Details from the Automic Web Interface
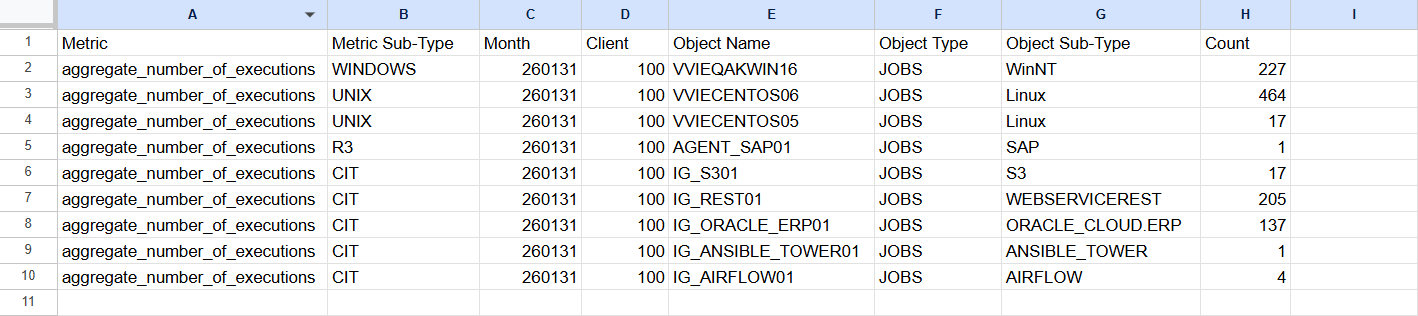
Once you have the list of your usage data for past full months, you can export the detailed information per node (SKU). The exported list includes the following columns:
-
Metric: Either node or execution-based
-
Metric Sub-Type: Type of Agent or Connection object
-
Month: Month of usage count
-
Client: Client number
-
Object Name: Name of Agent or Connection object
-
Object Sub-Type: Object type, such as HOST, CONN, and so on
-
Count: Count of the executions for the relevant metric
By default, the detail data is retained for 18 months.
To export it, you have two options:
-
select the relevant node and click the Export Detail Data button on the menu bar
-
right-click the relevant node and select Export Detail Data from the context menu
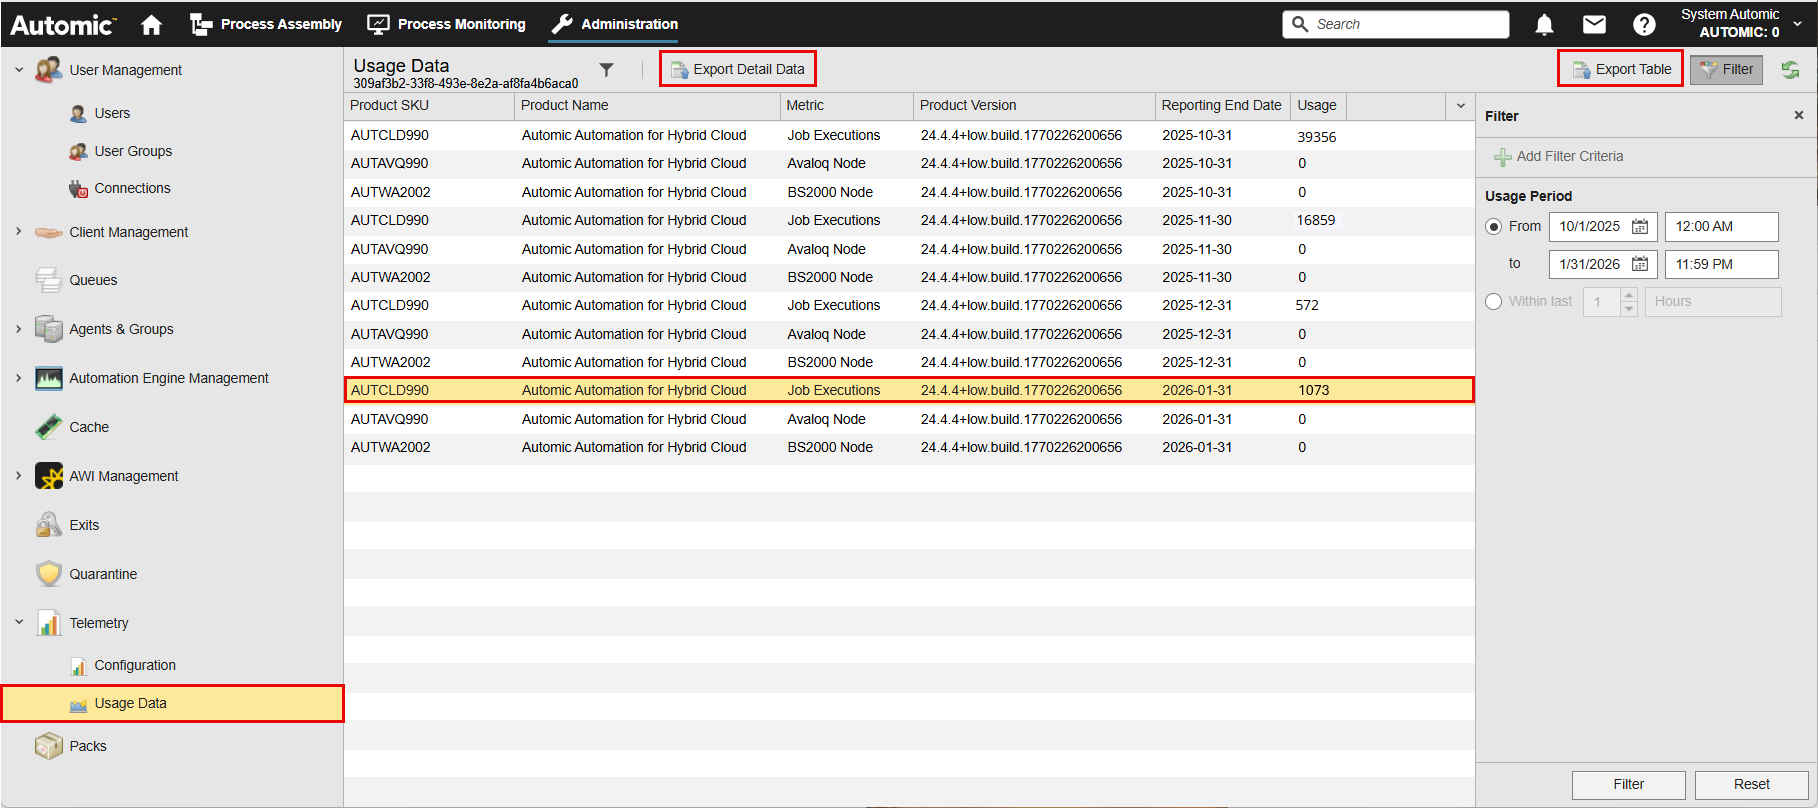
The usage data is exported as comma-separated values in a CSV file. The Export Detail Data option is available only when you select one node. If you select more than one node or no node at all, the option is disabled.
For example, this is the detail of the usage data for the node selected on the screenshot above:
Exporting the Usage Data Table to CSV
Use the Export Table option to extract the table content as comma-separated values in a CSV file. For more information, see Exporting Tables to CSV.
Exporting Usage Data Details via the AE REST API
You can also export telemetry data using the AE REST API. The connection can only be established with Client 0.
The API provides two endpoints depending on your use case:
-
To export detailed telemetry data:
Request: GET http://{host}:{port}/ae/api/v1/{client}/telemetry/export/details
Example: http://{AA_instance:port}/ae/api/v1/0/telemetry/export/details
-
To extract telemetry data for the past n months (including the current month), even while offline:
Request: GET http://{host}/ae/api/v1/{client}/telemetry/export/{n_month}
Example: http://{AA_instance:port}/ae/api/v1/0/telemetry/export/3
For more information, see:
Submitting Telemetry Data When Automatic Collection Is Disabled
If your environment or company policy does not support automatic telemetry data collection, you should collect and submit usage data manually. After retrieving the required usage data as described in the sections above, coordinate with your Broadcom account team or assigned partner to submit the information.
Your account team or partner will work with you to ensure the usage data is reported correctly.