
|
EMI - External Monitoring Interface |

EMI - External Monitoring Interface |
Configuration de l'interface EMI |

|
|
|
EMI - External Monitoring Interface |
EMI - External Monitoring Interface |
Configuration de l'interface EMI |
|
The External Monitoring Interface may replace the older SNMP-based monitoring technology. The EMI is based on the JMX technology, providing MBeans for all concerned components of the AE system.
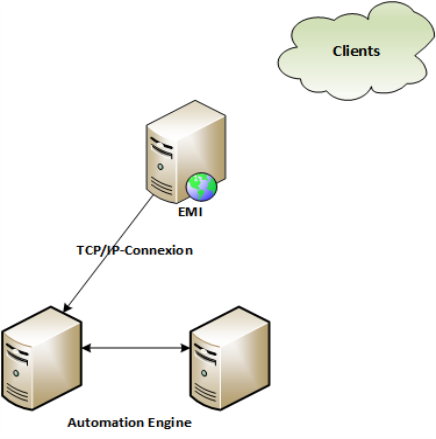
The External Monitoring Interface (EMI) is a tool which is used for monitoring the technical status of the AE. The EMI is based on the JMX protocol. JMX is a Java technology that supplies tools for managing and monitoring applications, system objects, devices and service-oriented networks.
The main idea for this JMX based solution is its possible use as a standalone application (monitoring can be done with each JMX based client, for example with Java Mission Control - the free JMX console) or integration into existing monitoring environments, that support JMX (for example HP-OpenView or IBM Tivoli).
Automic strongly recommends using this JMX-based monitoring solution instead of the older SNMP-based monitoring. JMX represents state-of-the-art technology, enabling easy integration with existent monitoring solutions. In addition the following advantages may be observed:
JMX: The Java Management Extension, a set of specifications for application and network management in the Java development and application environment.
MBean: JMX facilitates the centralized management of managed objects (called MBeans), which acts as Java wrappers for applications, services, components and devices in a distributed network.
MBean Server: The spine of the JMX architectural frame, allowing server components to plug in and discover all manageable objects.
The EMI solution stores the specific information and makes it available for JMX clients as Java Beans. The content (the MBeans) are write protected and may only be changed from inside the AE system. The EMI solution provides two types of monitoring - active and proactive:
The EMI solution connects to an AE and supervises the defined areas.
Its monitoring capability is restricted to one system/client at a time.
The monitoring possible with the EMI solution reflects the components visible in the AE's System Overview. Basically the same components may be monitored, regarding activities, messages, errors and warnings (for example, agents, database, cache, licenses, MQ, users, etc.)
The additional MBeans for control are those dedicated to the status of the EMI itself or the MessageBox (send notifications only), where MessageBox represents the Message Window in the UserInterface of the AE.
This image shows the MBean content displayed in Java Mission Control:

On the left you see the tree containing all MBeans available, on the right the attributes, type and description of the selected MBean are shown.
When selecting the "Notification" tab on the right hand-side, you will also find a 'Subscribe' checkbox there. Any user of the EMI may activate it, which will result in the display of Notification information for that particular MBean.

The MessageBox represents the Message Window of the AE's UserInterface, where the system's messages are displayed.
Each Notification represents one message sent from the AE and additionally shows the time stamp, severity, type and internal message representation.
The internal message representation is defined in the MSL file and in the MBean's attribute User Data. The Message record in the Notification consists of the combination of User Data values and the internal message representation .
The :SEND_MSG command generates messages in the AE, which will be broadcast to the MessageBox MBean as Notification. Thus the messages can be monitored via the EMI as well.
The EMI solution makes use of the AE's communication process (CP) list functionality, where automatic retries to connect to different communication processes are implemented as default.
The EMI solution is delivered with the following files you need for installation and configuration:
| File name | Description |
|---|---|
| emi.jar | Binary file with the EMI solution |
| uc4.jar | Communication interface for the AE |
| emi.ini | INI file |
| uc.msl | Translation file |
You will find these files in the directory: IMAGE:MONITORING
AgentBean - represents the Agent object on the system
CacheBean - represents the statistics information for a single system cache instance
ClientBean - represents the monitored client ( ![]() With one instance of the EMI one AE client can be monitored at a time)
With one instance of the EMI one AE client can be monitored at a time)
CollectionBean - describes several MBeans registered as one group on the MBeanServer. For example, Users represents a collection of UserBeans.
EMIBean - describes the status of the EMI solution, provides information about the connection and the connection status and displays this information in its Notification tab.
DatabaseBean - represents the DB information used in an AE system. The Mbean instance will have the same name as the DB on the DB system.
LicenceBean - represents the instance of a single license in the System Overview
MQEntryBean - represents a single message queue table used by the AE for message flow. The attributes of this Mbean can be used for the basic KPI of the AE.
QueueBean - represents the Queue object
ServerBean - represents an AE Server instance, equivalent to the Automation Engine entry in the System Overview
WorkloadBean - describes one row in the System Workload Table
UserBean - represents an instance of one user present in the AE system

|
1. |
Installation of files |
|---|
|
|
2. |
Starting the EMI Solution |
|---|
java -jar emi.jar [path/to/ini/file/emi.ini]
See also:
External Monitoring Interface Configuration