|
Features Overview |

Gantt Chart |
The Timeline |

|
The toolbar is available in the upper Gantt Chart area.

Reloads task data from the Process Analytics databaseA database is an organized collection of data including relevant data structures. and applies the currently active filters.
After an ETL process, you can use this command in order to display the current date.
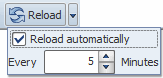
The dropdown menu also includes the Reload automatically option. Activating this setting and specifying a particular time has the effect that Process Analytics Studio automatically updates the displayed data in this time interval.
In the forecasts mode, you can select whether forecasts should be displayed and if so, how they should be displayed.
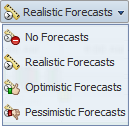
The following options are available:
Selection of Schedules, Period Containers, RemoteTaskManagers whose child tasks should be displayed in the chart.
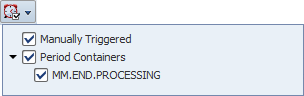
Long-running tasks such as Schedules, period containers and RemoteTaskManagers are not displayed in the Gantt Chart. Their subtasks, however, are displayed by default.
Clicking the Schedule symbol in the toolbar opens a dropdown menu that lists all long running tasks (ordered by type). By using this menu, you can determine the long running instances whose child tasks should be shown in the Gantt Chart (including forecast data).
You can use these buttons to change the display of parent tasks such as workflows.
Expand All expands all parent tasks - all subtasks are displayed.
Collapse All reduces all parent tasks - all subtasks are hidden in the Gantt Chart.
You can use it to create an image of the Gantt Chart view.
Can be used to adjust the display settings for the timeline.
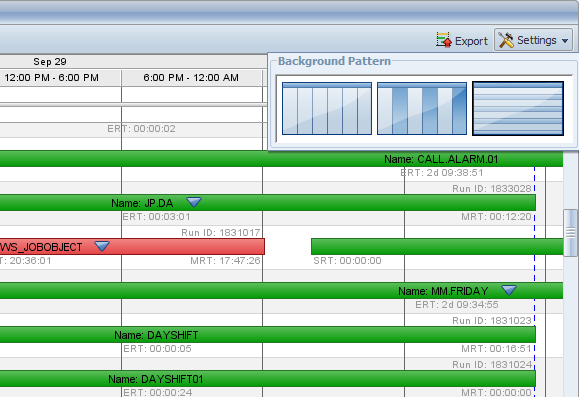
You can change the Gantt Chart's background pattern by using the Settings dropdown menu in the Gantt Chart's toolbar.
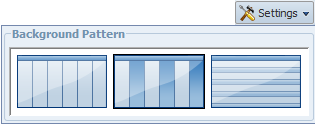
The following three options are available:
Vertical background pattern:
A white background pattern and gray stripes mark the boundaries of the time periods.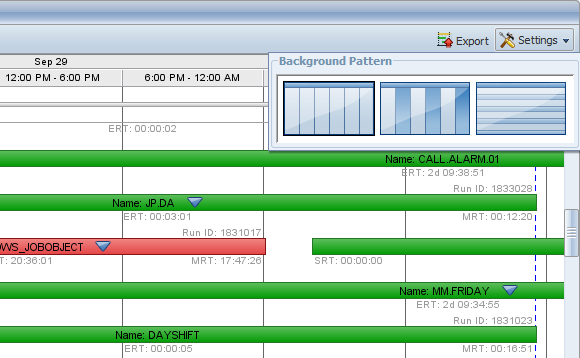
Vertically Striped Background Pattern:
Vertical stripes in two colors that refer to time periods. Gray and white colors alternate according to the time periods.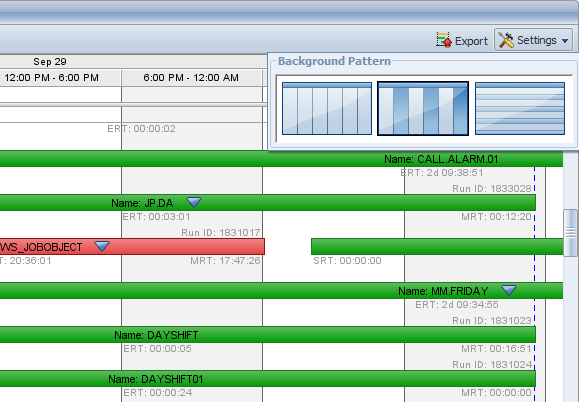
Horizontally Striped Background Pattern:
Vertical stripes in two colors that refer to time periods. The background colors alternate between white and gray according to the task lines.