
|
Chart Toolbar |

Gantt Chart |
Task Bars |

|
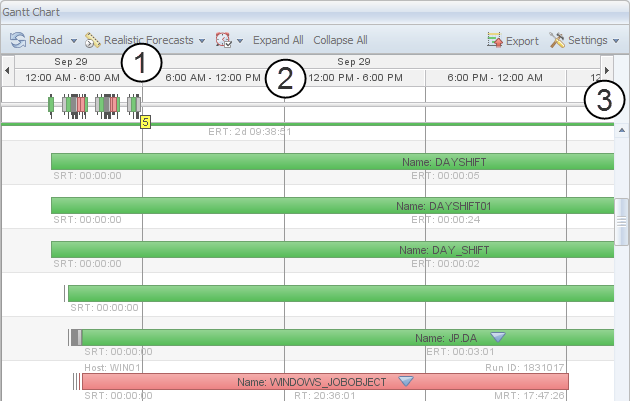
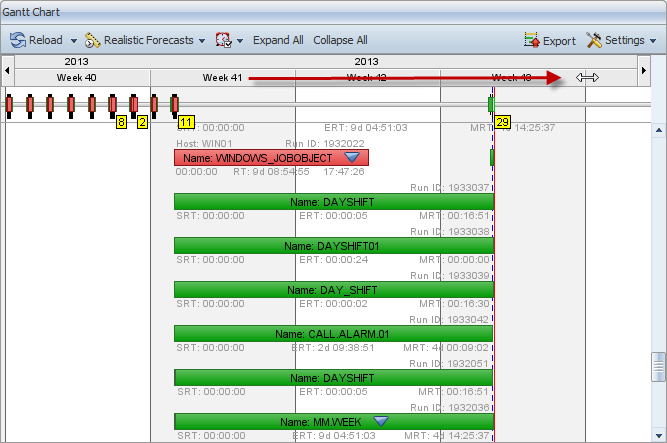
The timeline structures the Gantt Chart in particular chronological sections. The length of the time intervals and their corresponding unit depends on the current zoom factor. You can use the timeline to modify the size of the displayed time slot. It also provides functions that can be used to navigate through the time.
The timeline includes three components:
The timeline identifies the start and end time and the duration of the task bars.
The timeline offers several navigation and zooming options:
Keeping the CTRL key pressed allows to select several time periods. You cannot skip an interval that lies in between. Selecting time periods that are not positioned next to each other has the effect that all intervals that lie in between are also selected.
Multi selection is useful in combination with the Zoom In popup-menu command. The new time frame now complies with the selected time periods.
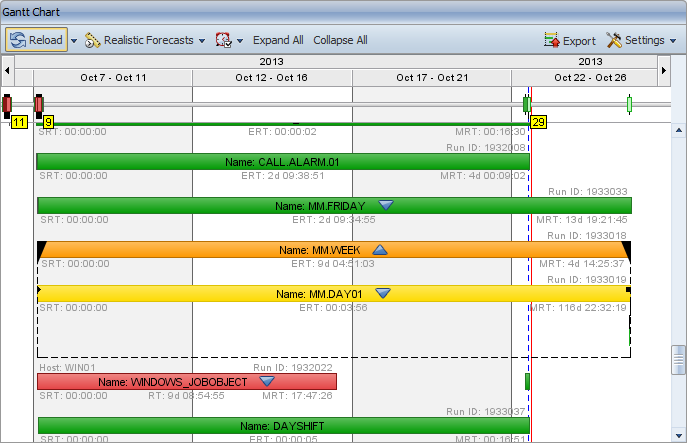
If you double-click a time period, you define it as a new time frame.
For example, double-clicking the time period 12:00 - 0:00 has the effect that the Gantt Chart only displays the data from 12 to 0 o'clock. The new time periods now have a length of one hour each.
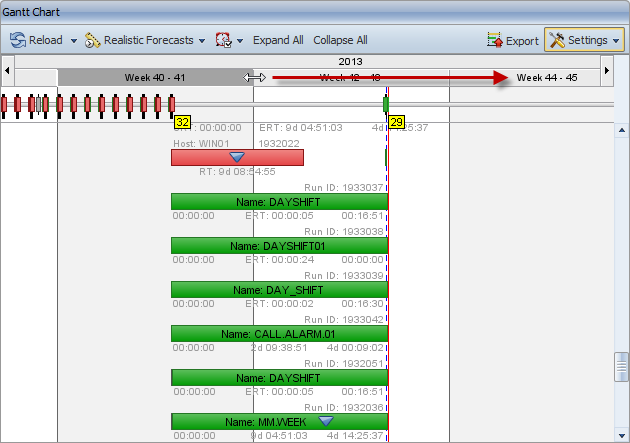
Move the mouse pointer over the boundary of a time interval. The mouse pointer changes to a double arrow. Keep the left mouse button pressed and drag the time period's boundaries to the right in order to zoom in and to the left to zoom out.
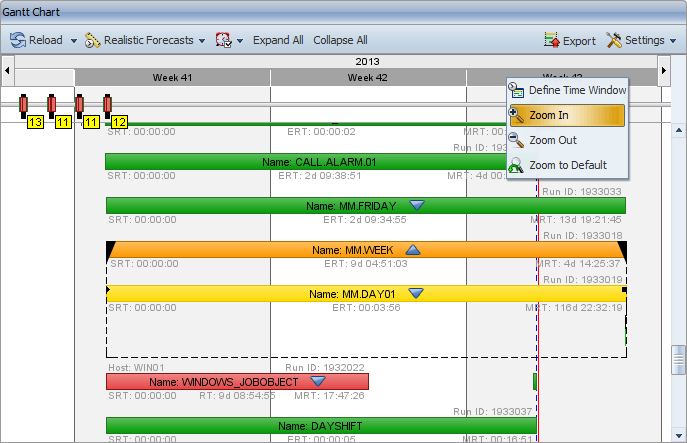
The following functions are available in context menus that are called for one or several periods (see multiple selection) in the timeline:
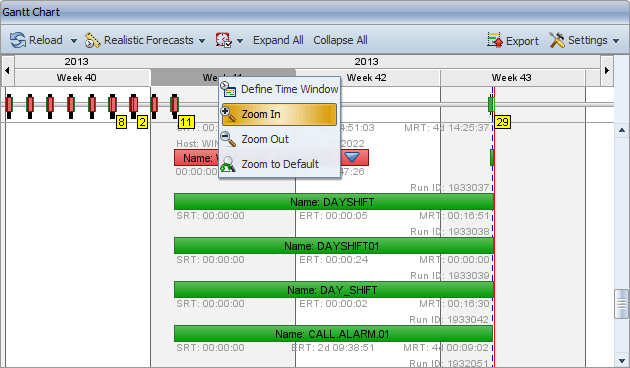
Zoom In:
This command defines the selected time periods as the new time window.
Zoom Out:
Enlarges the time window to the next zoom level. The selected time period is in the display center.
Zoom to Default:
Resets the zoom level to the default setting. In this case, the time periods have a length of two days each.
Two arrow buttons that are displayed at the right and left end of the timeline allow you to navigate through the data.
The left button is used to navigate to the past and the right button allows a chronological navigation to the future. A single click moves the timeline back or forth for one period (depending on the selected zoom factor). For example, if the time periods comprise of one hour, the timeline is moved for one hour.
You can also keep the arrow buttons pressed and scroll down.