
|
The Timeline |

Gantt Chart |
Timing Bar |

|
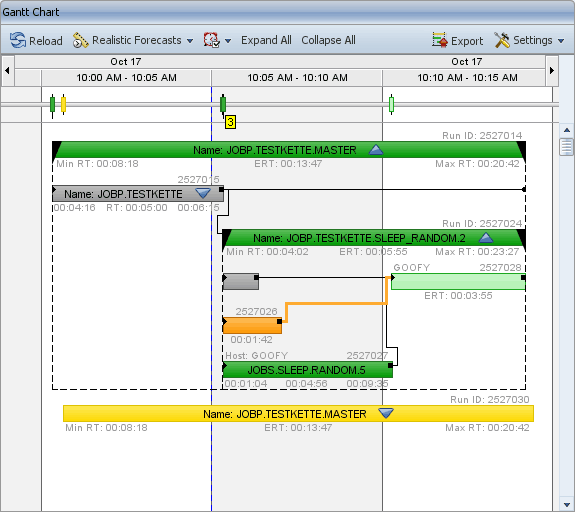
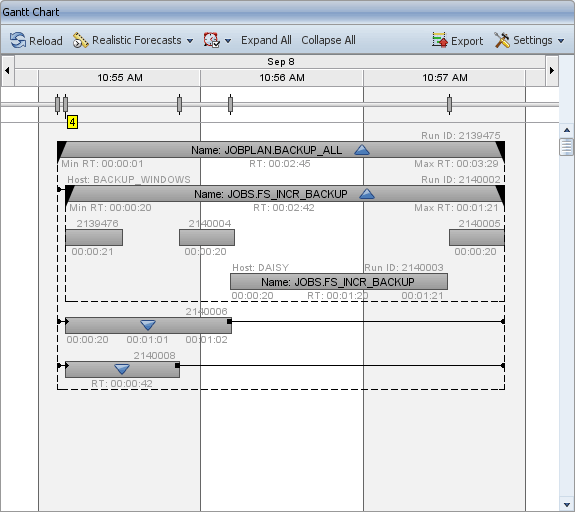
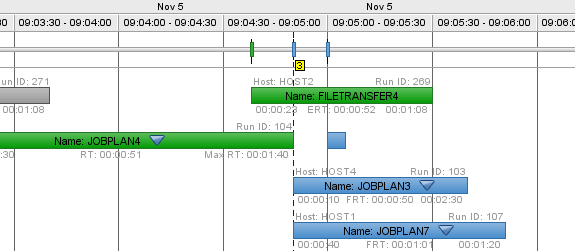
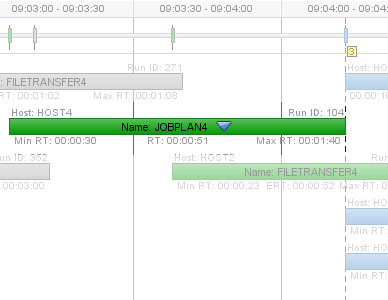
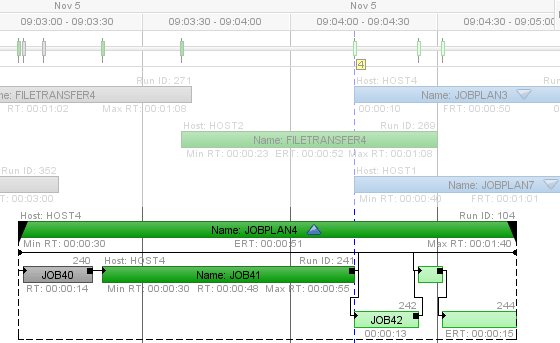
In the Gantt Chart, Process Analytics depicts the tasks of an AE system in the form of bars. The bar lengths refer to the (expected) runtimes. The task bars are arranged at the timeline depending on their start times. Each bar includes particular information.
The tasks of workflows and other parent objects are also shown with their connections and dependencies.
The task bars are arranged in a way that the available areas are filled from top to bottom without overlapping other tasks. The left end of a task is positioned in the uppermost line that is possible according to its start time.
Process Analytics distinguishes two types of tasks: single and parent tasks. Parent objects are tasks that include subordinate tasks (such as workflows or schedules).
The Gantt Chart displays only the subordinate tasks of long running tasks. You can use the toolbar (Schedule symbol) in order to determine the Schedules, period containers and RemoteTaskManagers whose tasks should be shown.
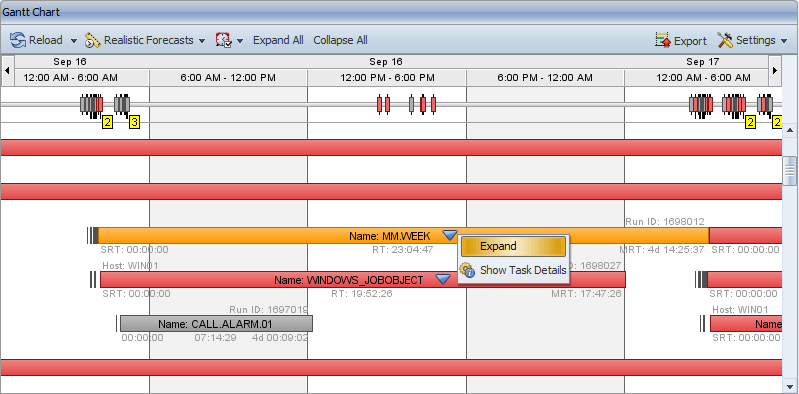
The bars of parent objects (such as workflows) whose tasks can also be shown include an arrow symbol. Double-click the parent bar or select Expand in the context menu to have them displayed.
The particular task states are visualized by the colors of the corresponding bars. The Info Box also informs about task states.
[ Labels ] [ Tooltips ] [ Popup Menu ] [ Tasks with a Minimum Runtime ] [ Single Tasks ] [ Parent Tasks ] [ Task Status ] [ ETL Indicator ] [ Scheduled Tasks ]
The left end of the task bar marks the task's starting point and the right end refers to the time at which the task ends. In other words, the length of the task bar visualizes the duration of the task.
Tasks that are still active or scheduled show the expected end that is calculated on the basis of the existing runtimes.
The task bars also include several labels depending on the zoom level.
Name:
Task name. It is displayed in the center of each bar. Parent objects show an arrow after their names The direction to which the arrow points informs whether the task is expanded or collapsed. You can expand a parent object to have its subordinate tasks displayed. Do so by double-clicking the arrow symbol or by using the corresponding context menu.
Host:
Name of the agent on which the task runs (if available). It is displayed in jobs and file transfers, for example.
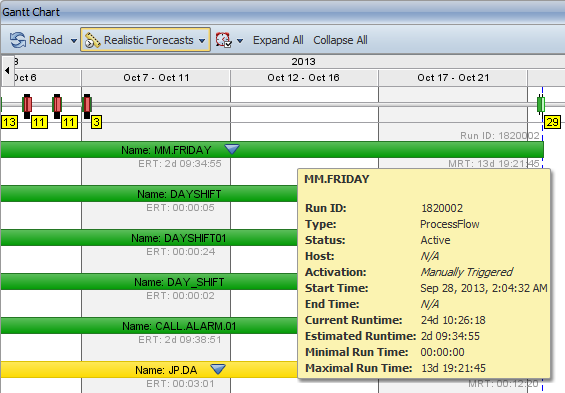
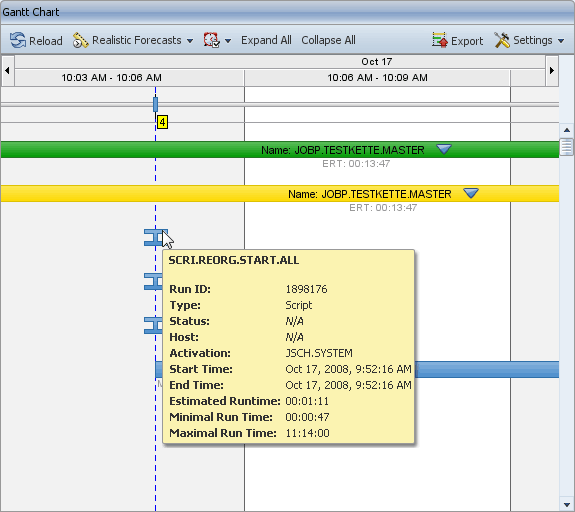
RunID:
Each task instance has its own RunID. The RunID is a number that is composed of up to 10 digits. It is used to uniquely identify tasks.
ERT, RT, CRT, FRT:
The runtime (RT) of ended tasks is shown in the center and below the bar. The minimum runtime is displayed to the left and the maximum runtime to the right (based on previous runtimes).
A task that has not yet finished (it has not yet started or is still running) displays:
The expected runtime is calculated on the basis of previous runs. The AE system's forecast function is used for this purpose.
Bars of activities that should have finished end at the ETL indicator (time of the last ETL process). These tasks show the current runtime (CRT) instead of the expected runtime (ERT).
Min RT, Max RT:
The minimum runtime (Min RT) is shown below the bar's left corner and the maximum runtime (Max RT) is shown below the bar's right corner. These are the minimum and maximum runtimes that have been measured so far. They can extremely deviate from actual runtimes.
Note:
Decreasing the zoom level can have the effect that some or all labels are not longer displayed because the bar area has become too small. In parent objects, the effect is that only the arrow symbol is shown and the task name is hidden.
[ Labels ] [Tooltips ] [ Popup Menu ] [ Tasks with a Minimum Runtime ] [ Single Tasks ] [ Parent Tasks ] [ Task Status ] [ ETL Indicator ] [ Scheduled Tasks ]
Each task bar that is displayed in the Gantt Chart provides a tooltip text that includes the most important information about a task. While labels of task bars are only displayed if the zoom level is high enough, the tooltip text is always available for the user.
To call the tooltip text, move the mouse pointer on a task bar.
[ Labels ] [ Tooltips ] [ Popup Menu ] [ Tasks with a Minimum Runtime ] [ Single Tasks ] [ Parent Tasks ] [ Task Status ] [ ETL Indicator ] [ Scheduled Tasks ]
The context menu of the bars includes different functions depending on the task type. The context menu shows different commands depending on whether the bar belongs to a parent object, a child object or an external dependency.
Bars of single tasks do not have a context menu.
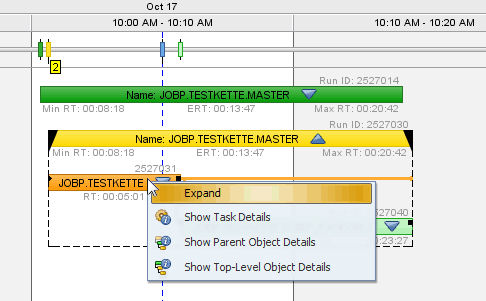
Show Task Details:
Opens the task's detail window. Only available in parent objects.
Show Parent Object Details:
Opens the detail window of the superordinate task. This command is only available in the context menu of tasks that are located in a parent task.
Show Top-Level Object Details:
Opens the detail window of the top parent ask.
This command opens the same window as the Show Parent Object Details command if the direct parent task is the top task. This command is only available in the context menu of tasks that are located in a parent task.
Expand / Collapse:
Hides or unhides the parent object's subordinate tasks.
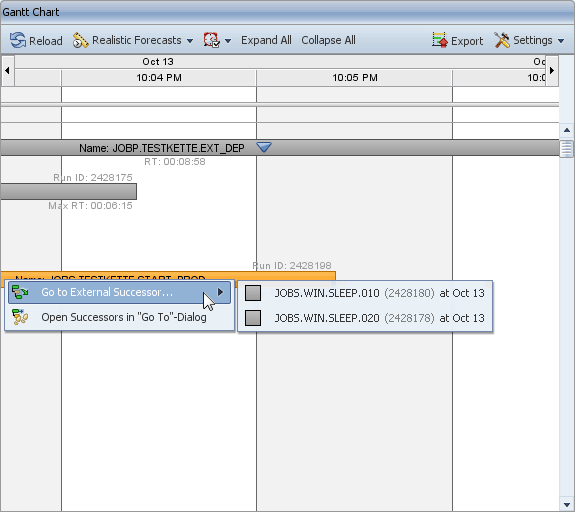
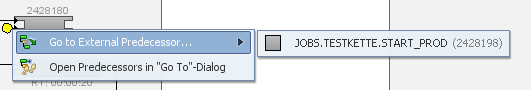
Go To External Predecessor:
Lists the external tasks on which a task depends. Only available in workflow tasks that are linked to at least one external dependency.
Go To External Successor:
Available in tasks that represent an external dependency. Lists all workflow tasks that depend on this external task.
Open Successors / Predecessors in "Go To" Dialog:
Available for tasks that have at least one external predecessor or successor. This command opens the Go To dialog that includes the preceding or succeeding task's RunID in combination with the keywords extsuc: or expre:.
[ Labels ] [ Tooltips ] [ Popup Menu ] [ Tasks with a Minimum Runtime] [ Single Tasks ] [ Parent Tasks ] [ Task Status ] [ ETL Indicator ] [ Scheduled Tasks ]
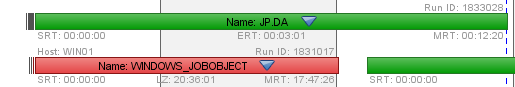
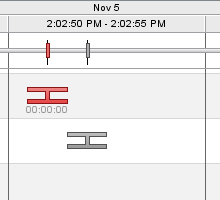
Tasks can have runtimes that are so short that the Gantt Chart bar is too short to be displayed in particular zoom levels. For this reason, the bars of these tasks are shown broader than they actually are.
These tasks are shown in the form of a horizontal H letter (see illustration below) in order to be distinguished from the usual bars. The vertical dash in the middle of the H-task bar complies with the actual start time and the real runtime.
[ Labels ] [ Tooltips ] [ Popup Menu ] [ Tasks with a Minimum Runtime ] [ Single Tasks ] [ Parent Tasks ] [ Task Status ] [ ETL Indicator ] [ Scheduled Tasks ]
the Gantt Chart shows the following single tasks:
Single tasks can be part of workflows that are shown in a reduced form by default. Expand the relevant workflow to view these tasks.
Dynamic jobs can only occur as the subordinate tasks of a RemoteTaskManager. Expand the relevant RemoteTaskManager to view them.
Events that were manually started by the user and in which the attribute Check has been set to Repeated are never displayed in the Gantt Chart.
[ Labels ] [ Tooltips ] [ Popup Manu ] [ Tasks with a Minimum Runtime ] [ Single Tasks ] [ Parent Tasks ] [ Task Status ] [ ETL Indicator ] [ Scheduled Tasks ]
As opposed to single tasks, parent objects include sub-tasks. Parent objects can also be part of other parent objects. Any type of nesting is possible. Process Analytics displays the following parent tasks:
RemoteTaskManagers require the attribute Terminate Queue autom. to be set in order to be displayed.
The subordinate tasks of Schedules and period containers are shown. You can use the Gantt Chart's toolbar (Schedule symbol) in order to select the Schedules and period containers whose tasks should be displayed.
To hide or unhide subordinate tasks in the Gantt Chart, you can expand or collapse the task bars of parent objects. By default, all parent objects are shown in collapsed form.
A blue arrow symbol displays to the right of the task name if a bar can be expanded in the Gantt Chart.
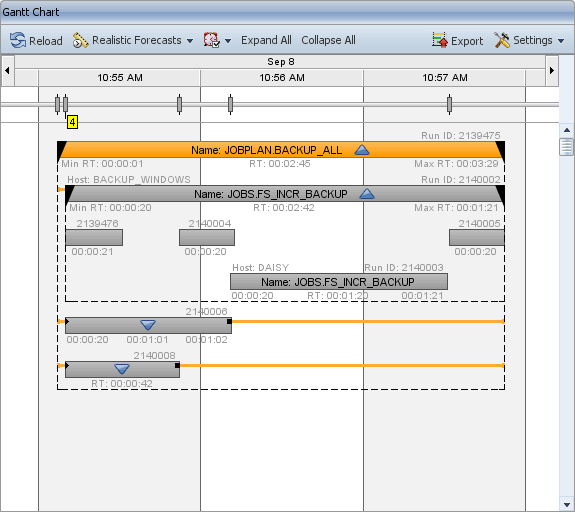
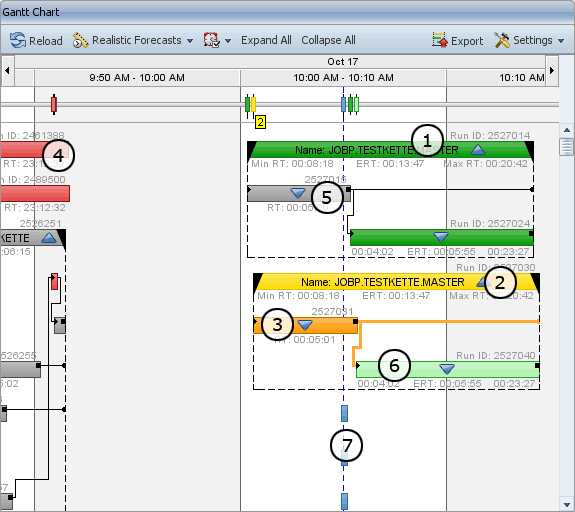
When a parent task bar is expanded, a dashed line encloses the included tasks and the blue arrow next to the parent object's name points upwards. The lines between the subordinate tasks represent dependencies.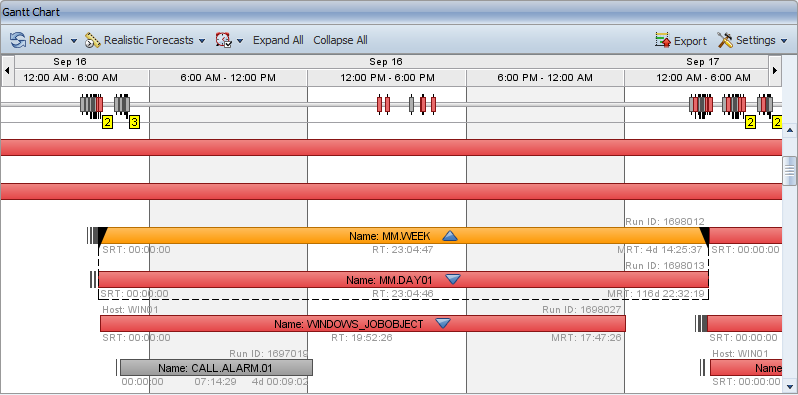
Process Analytics offers three options that can be used to switch between the expanded and the collapsed status of a parent object.
The Gantt Chart's toolbaralso provides commands that can be used to expand or collapse all parent objects.
Workflows are parent objects and can include child elements that serve to display hierarchical structures.
Explicit dependencies:
Connecting lines between the individual workflow tasks. Explicit dependencies show the tasks that are linked with each other. These lines can also be linked with a workflow's start or end.
The end of a line that leads to a task bar is indicated by an arrow (6). A black square (5) marks the beginning of a line. Lines that are linked with the workflow's start and/or end show a dot at the relevant end (1 and 3).
An arrow is shown if a tasks start at the same time as the workflow (2). A square that is displayed to the right of a task indicates that a task ends at the same time as the workflow (4).
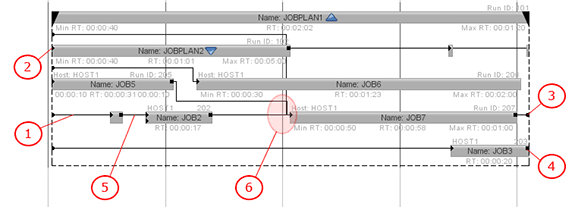
External dependencies:
External dependencies refer to a particular task. They are only used to start a workflow task if another task has been executed at a particular time and with a particular status (depending on the definition).
An external dependency can be an individual external task or a task of a different workflow. It can also be part of its own workflow provided that it is executed before the external dependency is checked.
Each external dependency has a context menu that includes the specific commands Go to External Predecessor / Successor and Open Predecessors / Successors in its Go To dialog. A description of these commands is available in the Popup Menu description.
Context menus for external dependencies are only available in the Gantt Chart panel. Right-clicking an external dependency in a detail view window does not open a context menu because the external tasks are mostly not included in the current tasks.
Each task bar and dependency that is displayed in the Gantt Chartt includes a tooltip text. Move the cursor over the task or dependency to have the tooltip text displayed.
The information that is provided in tooltip texts is also available in the Info Box.
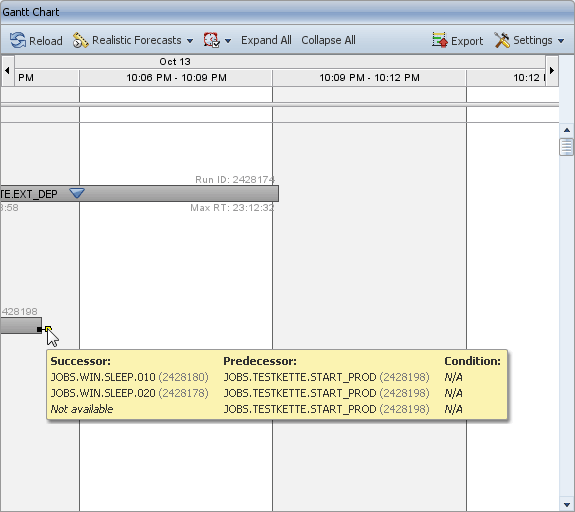
The tooltip texts of dependencies include the following information:
If a task bar is selected within an expanded workflow, the corresponding lines and dependencies are also shown in orange. If only dependencies are selected, they are increased. You can multi-select tasks and dependencies by keeping the CTRL key pressed.
Selecting the bar of expanded workflow has the effect that the lines that lead to the workflow's start and end are also highlighted.
[ Labels ] [ Tooltips ] [ Popup Menu ] [ Tasks with a Minimum Runtime ] [ Single Tasks ] [ Parent Task ] [ Task Status ] [ ETL Indicator ] [ Scheduled Tasks ]
Task bars in the Gantt Chartt have various colors depending on the various states and selection options.
(1) Running:Tasks that have not yet finished at the time of the last ETL process. The Gantt Chart shows the bars of these tasks in green.
(2) Blocked: Workflows whose execution has been blocked because of an error. Blocked tasks are displayed in yellow.
(3) Selected: User-selected tasks are highlighted in orange. This is the only color that does not depend on the task's status.
To select several tasks, keep the CTRL key pressed.
(4) Canceled: Tasks that have been canceled are displayed in red.
(5) Ended: The bars of tasks that have been finished successfully are displayed in dark gray.
(6) Upcoming: Tasks that are part of an active parent object but had still not started when the last ETL process was triggered. These tasks have the status Waiting for precondition and are displayed in light green.
(7) Forecasted: Future tasks that have not yet started at time of the last ETL process.
This is forecast data. The displayed start and end times are estimated. The bars of these tasks are displayed in blue.
[ Labels ] [ Tooltips ] [ Popup Menu ] [ Tasks with a Minimum Runtime ] [ Single Tasks ] [ Parent Tasks ] [ Task Status ] [ ETL Indicator ] [ Scheduled Tasks ]
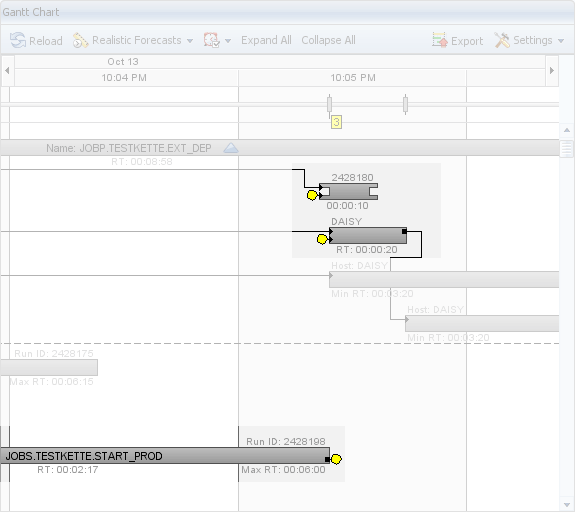
The ETL indocator is the vertical blue dotted line that indicates the time of the last ETL Process. The ETL process (Process Analytics Admin) loads the data from the AE databaseA database is an organized collection of data including relevant data structures. to the Process Analytics database. The ETL indicator indicates the status of the Process Analytics data.
All tasks that start after this line are forecasted and are displayed according to the specified forecast mode.
The vertical red line in the Gantt Chart signals the current date/time and changes accordingly.
[ Labels ] [ Tooltips ] [ Popup Menu ] [ Tasks with a Minimum Runtime ] [ Single Tasks ] [ Parent Tasks ] [ Task Status ] [ ETL Indicator ] [ Scheduled Tasks ]
In the Gantt Chart's toolbar, you can determine the forecast mode of the data that should be displayed. The following options are available:
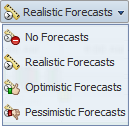
No Forecasts - Forecast data is hidden.
Realistic Forecasts - Forecasts are displayed, they are based on the scheduled start time and the estimated runtime.
Pessimistic Forecasts - Forecasts are based on the scheduled start time and the longest existing runtime.
Optimistic Forecasts - Forecasts are based on the scheduled start time and the shortest existing runtime.
Scheduled tasks are always displayed exactly at the line that indicates the last ETL process even if their scheduled start time has already been passed.
Scheduled tasks are hidden if:
The scheduled start time lies before the time of the last ETL process minus a particular threshold value. This value is specified in the Process Analytics Studio configurationA set of constituent components that make up a system. This includes information on how the components are connected including the settings applied. file studio.db.properties, parameter "cv_ForecastHidingThreshold=".
The following example explains the process:
Consider a forecasted task that shows a start time that is scheduled after the last ETL process. After the next ETL process and a data update, the task is still forecasted and has not yet started. The scheduled start time now lies before the ETL indicator.
The difference between the scheduled start time and the new ETL process is still smaller than the specified threshold value. Therefore, the task is still displayed and positioned in accordance with the ETL indicator.
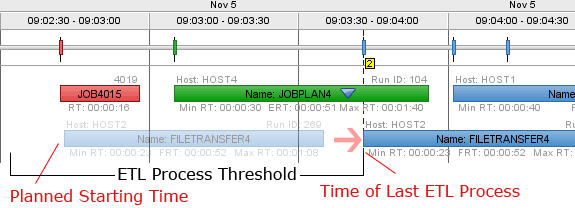
A new ETL process has been triggered and the user has updated the Process Analytics data. The difference between the time of the task's scheduled start and the last ETL process exceeds the threshold value. Therefore, the task is hidden.
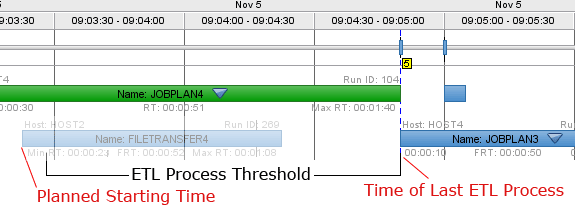
Let's assume that one or more scheduled instances of the same task show a start time that lies before the last ETL process. All scheduled instances of the same task are hidden as soon as an instance starts. The following example explains this constellation:
Two scheduled instances of a task are displayed. Their estimated start times lie before the last ETL process. The instances are displayed because of the fact that their start times lie within the threshold value (see above).
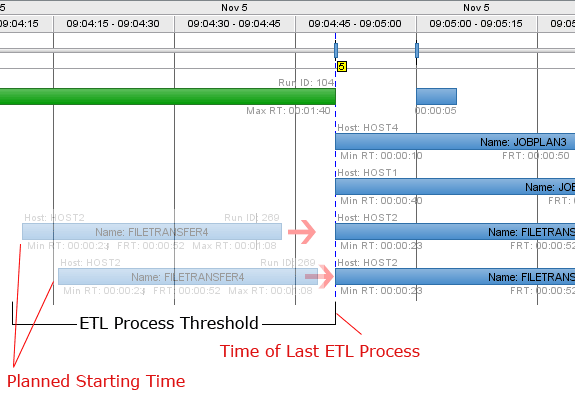
One of the two task instances has started in the meantime. Data is updated after a new ETL process.
Because an instance has already started, the Gantt Chart only displays the scheduled instance of the same task whose start time lies after the ETL process. The instances whose estimated starts lie before the ETL indicator are hidden.
Therefore, the illustration only shows the active instance.
Because active and upcoming tasks may differ from their forecasts, their visualization must be adjusted accordingly.
In a collapsed condition, a task's size in the Gantt Chart is defined by the task's FRT. When expanded, the FRTs of all subtasks define the parent object's size. Therefore, the size of a parent object can differ depending on whether it is collapsed or expanded.
Once a parent object is expanded, the calculated FRT is updated according to its subtasks and it is kept even if the parent object is collapsed again.
The subtasks can occasionally also show a start time that differs from the scheduled start time.