The Job Status Data Insight
The Job Status data insight is a tool to monitor the current job execution status of all jobs in the AAI. It gives you a snapshot of overall status by showing you the total number of jobs in every possible execution status. By defining advanced filters based on any combination of job definition and run properties, you can get a view of the jobs that have a recent run status that interest you.
This topic describes the Job Status data insight, what it contains, and what filter and view options it offers.
For general information about how to work with data insights, see Using a Data Insight. For information about creating and maintaining data insights, see Adding, Editing, Copying, and Deleting Data Insights.
This page includes the following:
Purpose
The Job Status data insight offers operators and workload administrators a quick overview of the most recent job execution status at the current time. You define the jobs that are included in this data insight using advanced filters based on any job properties.
As an operator, the Job Status data insight is a good addition to your dashboard, especially if you define several of these data insights with different sort criteria, such as different schedulers, and you place them on the same dashboard tab page. You can see at a glance when there is trouble with a certain scheduler.
Compare this with the Job Completion data insight that is similar, except that it shows the completion status of the most recent completed run of the jobs, and does not consider currently running executions. For information, see The Completion Status Data Insight.
Sample
The following is an example of a Job Status data insight. The toolbar has a detailed description of the filters that are applied. The graphic is a series of tiles with the number of jobs in each detailed status. For statuses that are scheduler-specific, the scheduler type is included in parentheses below the status.
The tiles are organized from left to right in degree of problematic to problem-free statuses, so you see the total of the biggest problems up front without scrolling. To see more status totals, use the arrows to the left and right of the row of tiles to scroll through the status tiles.
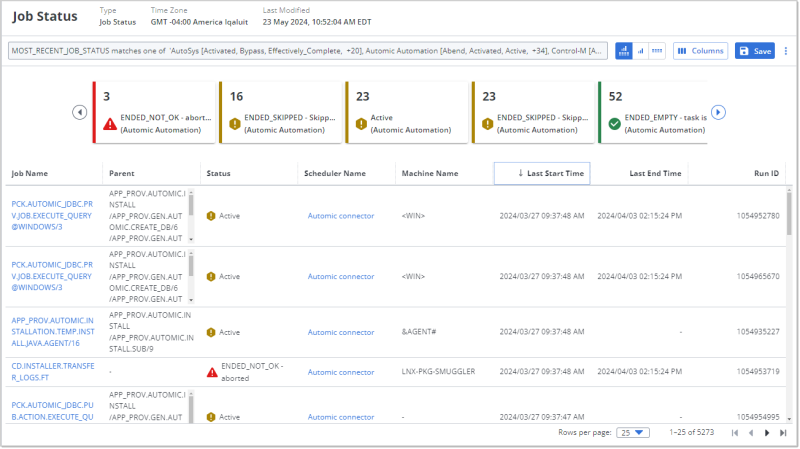
The general category of execution status is indicated by an icon and by the color of the icon as well as the left border of each tile.
-
Red and a warning triangle icon: Job runs that have failed to complete or predicted not to complete for some reason.
-
Orange and a diamond icon: Job runs that are on-hold, blocked, canceled or a similar status that has interrupted the run.
-
Brown and a hexagon icon: Job runs that have a status that means they ended but with neither a success status nor a failed status.
-
Green and a check mark icon: Job runs that have successfully completed or are predicted to complete successfully.
-
Black and a circle with a bar icon: Job runs with a status that cannot be interpreted by AAI.
Quick Filtering the Job Status Data Insight
The tiles on the data insight that show the number of jobs within each status also allow you to quickly filter the table of job runs by specific statuses. When you mouse over a tile, a checkbox appears in the upper right part of the tile. This is a toggle to filter the table the job runs with that status. This is how it works:
-
When you click the checkbox on a tile, the table is filtered to show only the job runs that match the tile's status.
-
You can select as many tiles as you want. The job runs for all the checked tiles are included on the table.
-
When you quick filter using the checkboxes on the tiles, that selection is added to the overall filters for the data insight that you see in the toolbar.
-
When you select a checkbox, the checkboxes stay visible until you uncheck them.
-
To remove the status on the tile as a quick filter, uncheck the box.
-
If you unchecked the last selected tile, you see the whole list based on the filters in the toolbar just as you do when no tiles are selected.