Setting Client, Server, Oracle Trace, and All Agent Debug
You can activate client, server, SQL trace, and all agent debug from the About Applications Manager window in the Applications Manager client.
You can select certain debug options from the About Applications Manager window in the Applications Manager client shown below.
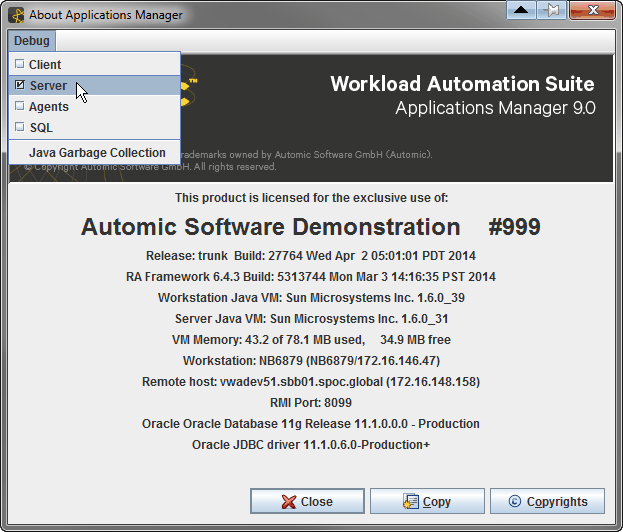
Select debug options from the Debug menu on the About Applications Manager window.
The debug options are:
- Client: Debugs Java used on the client machine. You may need to turn on client debug when you are getting errors in pop-up windows while using the Applications Manager, or when the Applications Manager client hangs. When you turn on client debug, it is also a good idea to turn on server debug, because server debug errors often accompany client errors. Turning on client debug is a two step process. You determine where to write the debug information and activate debug. Debug information can be written to a client machine in either a Java Console window, or a log file. When this box is checked, client debug is activated for an individual user's client machine. A setting in the Options.properties file allows you to activate client debug for all users who log into an Applications Manager automation engine.
- Server: Debugs the RmiServer process. When this box is checked, debug information from the current RMI server session is written to the RmiServer.<timestamp>.log file. When you turn RMI debug on from here, the logs are limited to the current session (in other words, what's going on right now with the RMI server and automation engine). A setting in the awenv.ini file allows you to see all of the information the RMI first loads on start-up.
- SQL: If you want to see what SQL is executed by the RmiServer process, you can turn on Oracle trace. Normally you shouldn't need to turn on general SQL trace for the whole product, because you can determine which SQL statements or procedures are having problems and trace only those statements or procedures. Debug information will be written to the trace files in the $ORACLE_HOME/rdbms/log directory.
- Agent: When checked, debug information is written to the AgentService.<timestamp>.log file for every running agent. Agent debug can also be written for a single agent when either debug=true is set in an agent's awenv.ini file or when the Agent debug box is checked in an agent's definition.
You open the About Applications Manager window by selecting About Applications Manager from the Debug menu on the Applications Manager desktop.
You can do a Java garbage collection to free up heap memory that is no longer needed by clicking Java Garbage Collection under the Debug menu on the About Applications Manager window. This will only send a hint to Java, so it doesn’t force it to collect everything.