To help you monitoring your processes and troubleshooting when something goes wrong, every run performed in your system is recorded and stored in the form of historical data presented in lists of Executions. They provide key information on what happened on each execution of each task; each row in the list represents an execution run of the task. By default, the most recent execution is displayed at the top of the list.
This topic provides information on the following:
- Overview
- Types of Execution Lists
- Accessing the Execution Lists
- List of Executions for Executable Objects
- List of Executions for Clients
- List of Executions for Agents
- List of Executions for Servers
The execution data lists are available for all executable objects, Agents, Clients and Servers. Each record in the list represents an execution run of the task or object. By default, the most recent execution is displayed at the top of the list.
Recording the execution data is triggered as soon as an object is activated and ends when the execution is completed. All Executions lists display real-time data, that is, task or object changes are reflected immediately.
Right-clicking a record on the Executions list opens a context-menu that provides access to the functions available for the selected task.
The system keeps the execution data until explicitly removed from the database.
There are four types of execution lists:
-
Executions
Available for tasks that are processed individually.
-
Child Task Executions
Tasks such as Workflows (JOBP), Groups (JOBG) or Schedules (JSCH) trigger the execution of other tasks (their children). The Child Task Executions is available for parents tasks and provides data on the execution of their children for a particular run.
Automatic file transfers that store the external reports in the Automation Engine are child objects.
-
Parent Task Executions
The Parent Task Executions is available for child tasks and provides data on the execution of both the parent and all its children.
-
Activator Executions
The activator is the instance that triggers the execution of a task. In the case of parent/child tasks, the activator of the child is usually the parent, but it must not always be so. If the child task is executed manually, for example, the activator is the user who triggered it.
-
Do one of the following:
- For Clients, Agents and Servers, open their respective lists in the Administration Perspective.
- For executable objects, open the Process Assembly (for objects) or the Process Monitoring (for tasks)
-
Right-click the task or object and select one of the following options in the context-menu:
- Executions
- Child Task Executions
- Parent Task Executions
- Activator Executions
List of Executions for Executable Objects
All execution lists of executable objects display the same columns. Some are hidden by default. See Working with Tables for details on how to modify customize them.
The definition of the object that underlies a task includes an attribute that determines when that task should be deactivated automatically (see Automatic Deactivation Section). Deactivated tasks are not displayed on the list of Tasks in the Process Monitoring perspective. However, their Executions lists are accessible.
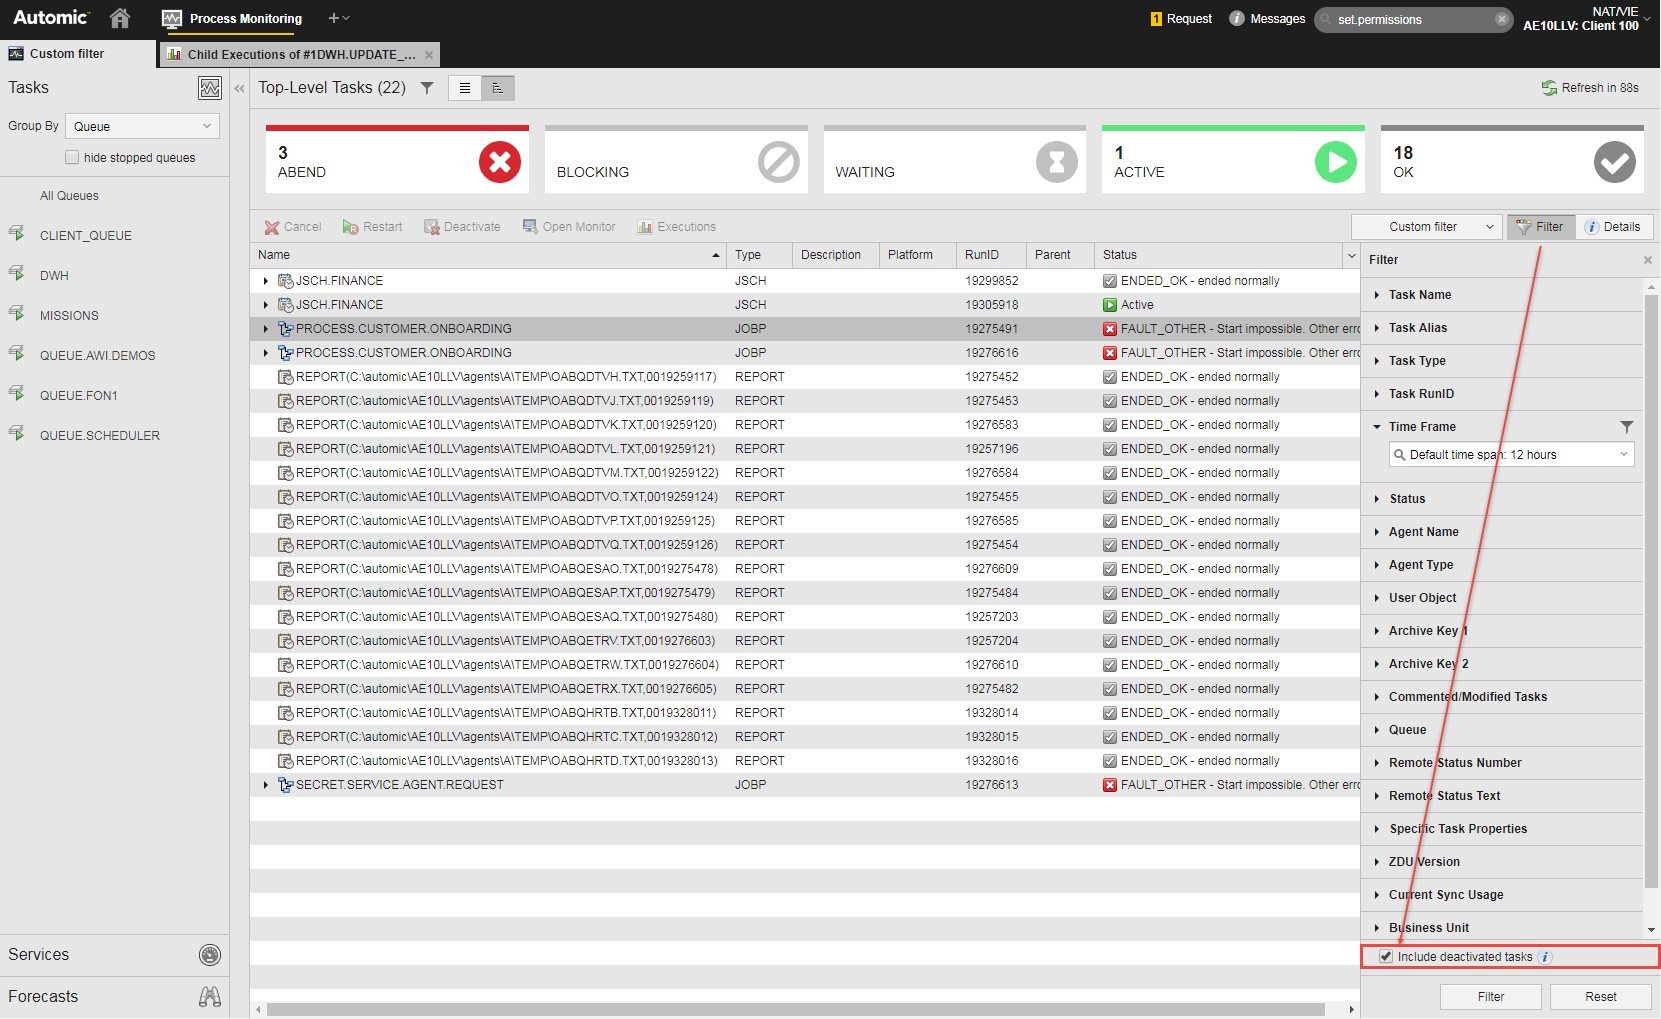
Filtering for Deactivated Tasks
When defining executable objects, in the Automatic Deactivation Section of the Attributes page you can specify when they should be deactivated. Deactivated tasks are not visible in the Tasks list in the (Undefined variable: UIElements.ProcessMonitoring) perspective. If you want to see them on the list, activate the Include deactivated tasks checkbox at the bottom of the Filter pane. This sets the Time Frame automatically to Default time span: 12 hours. This means that all tasks that have been deactivated within the past 12 hours will also be included in the Tasks list. You can change the predefined time span.
This functions enhances the information provided by the list of historical data in the Executions lists.
Activating this option may impact your system performance.
List of Executions for Clients
Recording the client execution data begins as soon as it starts and ends when it terminates.
Client execution data provide information on the status of your client sessions. Each row on the list corresponds to an execution run and provides its key data.
Recording the agent execution data begins as soon as it starts and ends when it terminates. Additionally, a new record is created when the log file changes.
It is critical that the agents are up and running for your workflows and processes to run smoothly. If an agent has connection problems, you can start searching for the reason in the Executions list. In addition, more detailed information on each record is also available from this list via the details and reports.
Note that, since it is possible to perform multiple logins on an agent, each modification of the login information results in a new record in the Executions list.
The Agent execution data is available in client 0 only.
List of Executions for Servers
The server statistics are available from the Processes and Usage list and provide details on the status of the connection.
See also: