Managing an Instance of the IWSz Server for AAI
After creating, configuring and implementing an instance of the IWSz Server for AAI, you can manage it either automatically, which is the recommended method, or manually. This topic describes the tasks you need to perform on the occasions that you must manage the instance manually.
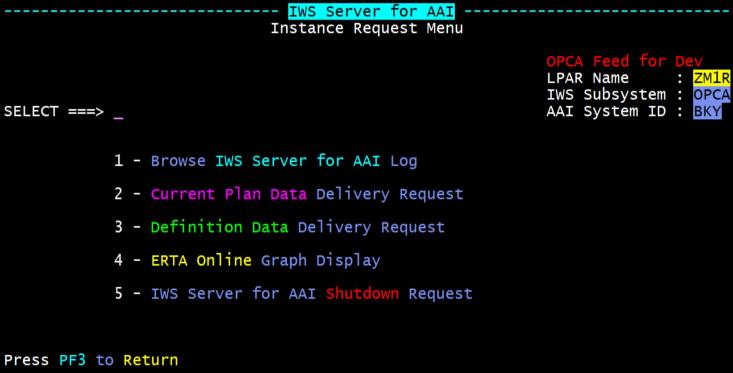
In IMS use the M - Menu for Instance option to open the IWS Server for AAI - Instance Request Menu, where you have the following options:
-
1 - Browse IWSz Server for AAI Log
Option 1 - Browser IWSz Server for AAI Log option opens a browse view into the IWSz Server for AAI active STC log messages. The Browse View option will use the output access API that was selected at installation time, either SDSF or Sysview
This option works only when the IWSz Server for AAI instance is active and the output access is available to the user.
-
2 - Current Plan Data Delivery Request
Creation of the Current Plan Data and delivery of the two files that AAI requires to maintain the view of planned workloads in IWSz is normally initiated through the Current Plan Request Step JCL member CPOPyyyx that is specific for each Instance of the IWSz Server for AAI and found in the yourHLQ.CUSTLIB Library.
In the event of a problem occurring with the generation and/or delivery of the Current Plan Data files, you can use this to re-initiate the creation and delivery process manually. When you use this option, a request is issued to the IWSz Server for AAI to start the Current Plan Data Delivery (CPD) “child” process.
This menu option is available only when the IWSz Server for AAI instance is active.
-
3 - Definition Data Delivery Request
Use this option to issue a request to the IWSz Server for AAI to initiate the generation and delivery of the IWSz Definition Data files by starting the ADD “child” process. It is a recommended best practice to configure the “Server for AAI” Instances perform Definition Data Delivery automatically at the time(s) specified in the server configuration. For information, see Defining the IWSz Server for AAI Settings in Configuring an Instance of the IWSz Server for AAI.
However, if a refresh of the IWSz Definition Data files is required at some other time, then you can do that manually using this option.
This menu option is available only when the IWSz Server for AAI Instance is active.
-
4 - ERTA Online Graph Display
The Event Run Time Analysis (ERTA) function in theIWSz Server for AAI has been described previously in the Implementing an Instance section of this documentation as part of the Server for AAI Configuration settings whereby a .csv format file can be created daily to provide the data for creating a graph of the elapsed run time of the IWSz Event Data generation program for performance analysis and review.
Using Option 4 to display an ERTA graph on the screen which shows the run time of each Event Cycle for the currently active IWSz Server for AAI Instance and is created by dynamically processing the active STC Log to obtain the Event program run time from each Cycle.
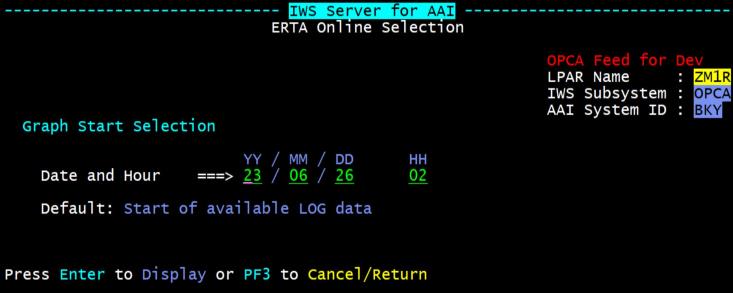
The ERTA Online Selection panel contains the start date and time of the first Event Cycle. You can keep these or overwrite them to see the Online Graph data from a later date / time. Then, press Enter. The Online ERTA Graph panel appears starting at the specified date and time.
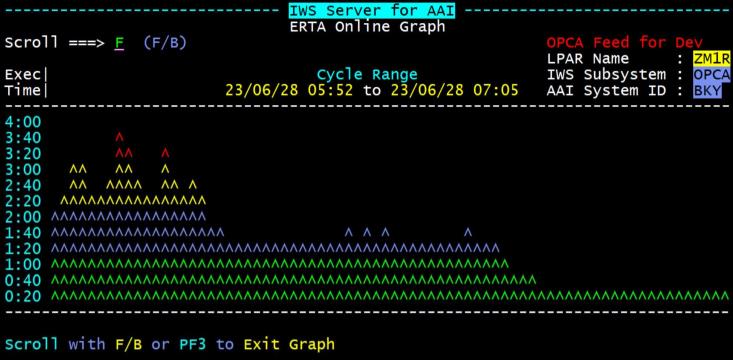
On the left side of the display is the Event program Execution Run Time range values that are created as 12 rows, using the longest run time value divided by 12 to determine the value for each row.
The body of the graph display uses columns of the ^ symbol to represent the run time of each specific Event Cycle, showing how the run time for each Event Data generation can vary from Cycle to Cycle. The date and time of the first (left) and last (right) Event Cycle displayed is shown above the graph body as the Cycle Range in yellow.
Color coding the ^ symbol provides visual clues as to whether any specific Event Cycle Run Time was above or below the average, based on the maximum value found over the duration the IWSz Server for AAI has been active. The green and blue ^ symbols are below average values whilst the yellow and red ^ symbols are above average values. In the example shown above the average run time for the Event program per Cycle is just over 2 minutes (between the last blue line of 1:54 and the first yellow line of 2:13). This makes it easier to identify periods of the day when the run time of the Event Cycles are higher than normal, possibly due to the load on the LPAR or the quantity of Event Data being generated.
The ERTA Extract Data file that can be used to create daily graphs includes the amount of Event Data being generated in each Event Cycle and can therefor provide a better visualization of Event generation Run Time in comparison to the amount of Event Data being generated for that Cycle.
Press Enter to scroll the graph (by default) forward in time through the available data showing the Event Run Time values for 74 Event Cycles per screen. Overwriting the Scroll field at the top left with B will cause the display to scroll backwards from the currently displayed range of Event Cycles. To continue scrolling backwards through the available data, the scroll field must be overwritten with B each time as it will revert to the default of F (Forward Scroll) on each display.
-
5 - IWSz Server for AAI Shutdown Request
Usually, the IWSz Server for AAI instances are configured to start and stop the Primary STC automatically. However, on some occasions, you might want to shutdown a server instance manually. Use this option for that purpose.
This option is only available when the IWSz Server for AAI STC is active.
For information about automating startup and shutdown of the server, see Automating an Instance of the IWSz Server for AAI.
See also: