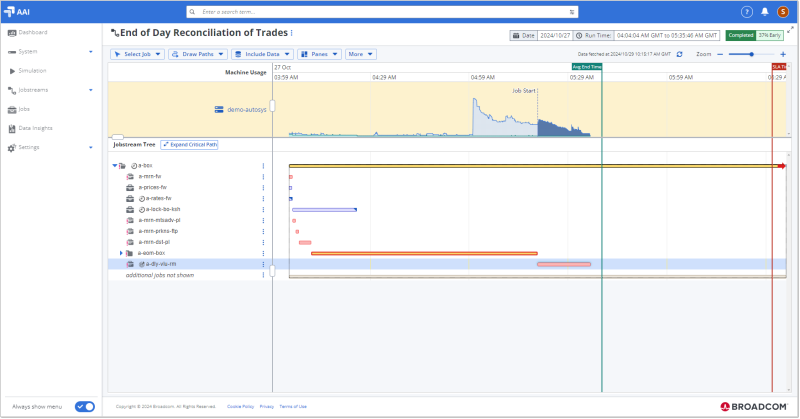
Viewing Jobstream Machine Usage on the Gantt View
To help you understand the load that a jobstream puts on your physical server resources and how that compares to the full load on the physical resource, you can view the machine usage of a jobstream run right on the Gantt view of that run. This topic describes how to open the machine usage pane and how to work with it. A similar feature allows you to understand the usage on virtual resources. For information, see Viewing Jobstream Virtual Resource Usage on the Gantt View.
This page includes the following:
What Is Machine Usage and When Is It Useful?
The jobs scheduling criteria includes dependencies like predecessors, time based conditions. Due to complexities in jobs design sometimes many jobs would be eligible to run on a particular machine at the same time causing heavy loads on the machine and unpredictable execution times.
How to Access Machine Usage
If AAI has machine usage data from the scheduler that the jobs of a jobstream run in, you can view a graph that depicts the usage data of the job runs in an additional pane on the Gantt view for the jobstream run. From there, you can get further details about the jobs that ran on each machine.
To open the Machine Usage pane
-
From the Gantt view for a jobstream run, click the Panes button on the toolbar above the Gantt timeline.
-
Select Machine Usage.
The Machine Usage pane appears below the toolbar and above the timeline.
Note:You can select the Machine Usage option only when the scheduler's machine usage data is available. Otherwise this option is greyed out.
To close the Machine Usage pane
-
From the Gantt view for a jobstream run, click the Panes button on the toolbar above the Gantt timeline.
-
De-select Machine Usage.
Understanding the Machine Usage Pane
When you open the Machine Usage pane, it appears immediately below the Gantt chart toolbar.
What You See in the Machine Usage Pane
In the Machine Usage pane, you see two lines that run horizontally from the beginning of the jobstream run to the end. There are two lines under which are shaded areas:
-
The upper line and lighter shaded area shows the total machine usage over the course of the jobstream run.
-
The lower and darker shaded area shows the machine usage of the jobs in the current jobstream over the course of its run.
The vertical axis does not show measures of processing load nor indicate machine capacity. Instead, it is scaled dynamically to accommodate the highest peaks of usage during this jobstream run so that the graphic can show you the proportion of usage of all jobs on the machine compared to the usage of the jobs from the current jobstream.
The milestone flags for Avg End Time and SLA Time run through the Machine Usage pane.
If more than one machine is used for the jobs in this jobstream run, you see a section for each participating machine, stacked one over the other.
Using the Machine Usage Pane
Use the Machine Usage pane to get an overview of machine usage at the time that your jobstream runs so that you can determine whether your jobstream run is getting taking too long to finish and meet its deadline because its jobs are trying to run at a time that the machine it runs on is busy with other jobs and processes.
By comparing the difference between the upper line for the overall usage of all jobs at any time and the lower line for the usage of your jobstream's jobs you can identify times that the machine is heavily used for jobs outside your jobstream. From the size of the difference, you can learn about the resource allocation for your jobs as follows:
-
The bigger the difference between the two lines and the areas they delineate, the busier the machine is.
-
Where there is only a small shaded gap between your jobs and all jobs and the two lines are near or overlap, you know that the machine is mostly or completely dedicated to the jobs on this jobstream run.
Finding where a job's usage is on the chart
To see the machine usage for a specific job, click the job name in the Jobstream Tree or its execution bar on the Gantt chart. The area on the Machine Usage chart is highlighted in dark shading to show the usage of both the job (the lower shaded area) and the total usage for all jobs (the total shaded area) during the time interval that the job runs on the machine. The run interval is delineated with flags at the points in time of the Job Start and Job End.
If you see that your job is allocated only a small portion of resources compared to the full resource usage at that time, you can investigate which other jobs are running to determine an optimization strategy.
Getting details of all jobs running on the machine
To see a list of all jobs that are running on a machine at the time of your jobstream runs, click the machine name in the pane above the Jobstream Tree. This opens a page with the details of all jobs running on the machine. For more information, see Understanding the Machine Usage Details Page.
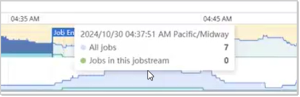
Getting more usage information on mouseover
When you mouseover any point in time on the Machine Usage chart , a pop-up tooltip appears showing the exact time and the number of All jobs that are running at that point and the number of Jobs in this jobstream that are running on this machine at that time.
Zooming on the Machine Usage pane
The Machine Usage always remains parallel to the Gantt timeline. If you zoom the Gantt timeline in or out, the Machine Usage pane zooms with it.
Understanding the Machine Usage Details Page
When you click the name of a machine in the Machine Usage pane on the Gantt view, you open the details page for that machine. On this page, you see all jobs that ran on the machine in the selected time interval.
As with the graph in the Machine Usage pane on the Gantt view, the graph here shows the total usage from all jobs in the light blue area, as well as the usage of the jobs from your jobstream, in the turquoise areas. Both of these are areas with the area for this jobstream never exceeding the total usage area.
The table below the graphic lists the jobs that ran on the machine with some run data. The following are the columns that you see on the Machine Usage Details table (required columns are marked with an asterisk (*)):
-
In Jobstream:For jobs that ran in the selected jobstream, this column has a shaded cell a checkmark.
-
Start Usage:* The time that the job started to run on the machine. Note that because a job run can be distributed over different machines, this time does not have to coincide with the job run start time.
-
End Usage: The time that the job stopped running on the machine. Note that because a job run can be distributed over different machines, this time does not have to coincide with the job run end time.
-
Job Name:* The job's name
-
Parentage: See the parent hierarchy of the job in that run
What you can do on the Machine Usage Details page
When you click the name of a job, the time span when that job ran is highlighted on the chart. When you mouse over any point on the graph, a pop-up tooltip appears showing the exact time and the number of All jobs that are running at that point and the number of Jobs in this jobstream that are running on this resource at that time.
See also: