The Gantt Menus and Their Options
The Gantt chart toolbar contains various menus with options that you use to control which details that you want to see in the visualization of the jobstream run, as well as options for researching jobs, and sharing and exporting the data on the page.
The left part of the toolbar contains the following menus:

-
Select Job menu
-
Draw Paths menu
-
Include Data menu
-
Panes menu
-
More menu
The options on each of these are described in the following:
The Jobs table that you can open on the Gantt page also has a toolbar of its own. Those options are not covered in this topic. For information about those, see Understanding the Jobs Table on the Gantt Page.
The Select Job Menu on the Gantt Chart
Use following options on the Select Job menu on the Gantt chart to navigate to within the Jobstream Tree to specific jobs. These can be particularly helpful in large jobstream and jobstreams with many nested container jobs.
-
Previous Job in Critical Path : Move up the Jobstream Tree (and the jobstream run) to the nearest critical path job before the job that you are currently positioned at. Click this again to the move to critical path job before that and so on.
-
Next Job in Critical Path: Move down the Jobstream Tree (and the jobstream run) to the nearest critical path job after the job that you are currently positioned at. Click this again to the move to critical path job after that and so on
-
Target Job: Go directly to the target job, which is marked with a bull's-eye icon. This quick positioning is especially helpful when the target job is somewhere in the jobstream other than the last job. With large jobstreams, one click can take you to the target job faster than scrolling.
The Select Job menu stays open so that you can continue to navigate using it. This is helpful when you want to move from one critical path job to the next or previous through a big jobstream.
Critical path jobs have pink execution bars and critical path container jobs have a red border around their yellow execution bars. On the Jobstream Tree, a red exclamation point on the icon for a job indicates that the job is on the critical path of the jobstream run.
The Show Critical Path option on the Draw Paths menu does not have to be toggled on to use the previous/next actions here on the Select Job menu.
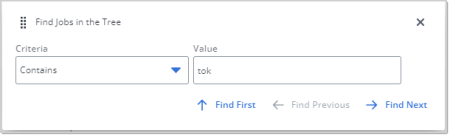
Find Jobs on the Gantt Chart with Job Name Criteria
In addition, the Select Job menu has a Search Job option that opens the Find Jobs in the Tree dialog where you can enter search criteria for a job name to find a job or jobs.
-
Use the Find First, Find Previous, and Find Next to continue navigating to other jobs that meet your criteria.
-
When you are finished with your search, click the X in the top right to close the dialog.
The Draw Paths Menu on the Gantt Chart
Use the options on the Draw Paths menu on the Gantt chart to toggle on and off additional connecting lines that show certain relationships between jobs. When you toggle one of these options on by selecting it on the Draw Paths menu, the action applies to the entire Gantt chart. The following are the Draw Paths menu options:
-
Show Predecessors of Selected Job: When this is selected, whichever job you select will show a blue, fine, dotted line with an arrow pointing to the current job and starting at the job that executes before it in the jobstream run. As you select different jobs, the predecessor line for the selected job appears. This is valuable information about dependencies that are likely to affect the successful start of the selected job.
-
Show Successors of Selected Job button: When this is on, whichever job you select will show a blue, medium-weight, dotted line with an arrow pointing from the current job to the job that executes after it in the jobstream run. As you select different jobs, the successor line for the selected job appears. This is valuable information about dependencies that are likely to affect jobs down the line when the selected job fails or delays.
-
Show Critical Path: When this is selected red lines connect the jobs that are on the critical path throughout the jobstream, and stay on until you de-select this option and regardless of what you have selected on the Gantt page.
Each critical path job can have two lines coming in and out of it:
-
A line with an arrow pointing to it and coming from the critical path job that comes before it in the execution sequence. The first job on the critical path does not have this.
-
A line from the critical path going to and pointing to the critical path job that comes next in the execution sequence. The last job on the critical path does not have this.
By showing the critical path sequence you can get the complete picture of the jobs that are essential to the successful completion of the jobstream run.
Note:Critical path jobs have pink execution bars and critical path container jobs have a red border around their yellow execution bars. On the Jobstream Tree, a red exclamation point on the icon for a job indicates that the job is on the critical path of the jobstream run.
You can also turn move from one critical path job to another with the Previous Job in Critical Path and Next Job in Critical Path actions on the Select Job menu.
-
The Include Data Menu on the Gantt Chart
The Include Data menu on the Gantt page offers you options to view additional graphical information on the Gantt page about the job runs. This includes average run indicators based on your selection and unusual job run statuses that cause the job to fall out of the jobstream flow. The following are the Include Data menu options:
Average Job Runs: This opens a submenu from which you select among different options for whether and for which jobs you want to see average run lines on the Gantt chart. The submenu contains the following options:
-
Show Average Runs (selected by default): Select this to see the average duration of each job on the Gantt timeline. The duration is depicted with a light green line under the execution bar for each job, including container jobs. This makes it easy for you to compare the duration of the current run of the job to its typical and expected duration..
-
Only Job in Critical Path (selected by default):
-
INCLUDE LONGER/SHORTER THAN AVG Select one of three options for which kinds of jobs you want to see the average run duration lines under their job execution bars on the Gantt chart.
-
All jobs (default): Show the average run duration lines for all jobs
-
Only job that run longer than average: Show average run durations lines only for job runs that exceeded their average run times. This is helpful to identify jobs that might be holding up an earlier completion for the jobstream.
-
Only job that run shorter than average: Show average run durations lines only for job runs that took less time to complete than their average run times. This is helpful to identify what circumstances led to certain jobs to have a shorter runtime.
Your selection here is stored with the jobstream
-
-
Unlinked Job Runs: When this is selected, you see any unlinked job icon (the icon that you see next to this menu option) at the end of each job that AAI considers to be unlinked. An unlinked job is one that is referenced in the AAI database and runs during the time frame of the jobstream run, but it is not incorporated in the jobstream definition.
Identifying unlinked jobs can uncover jobs that should be in the jobstream but are not for some reason. As such, unlinked jobs can point to a deficiency in the jobstream calculation.
-
No Run of Job: When this is selected, you see the no-run job icon (the icon that you see next to this menu option) wherever AAI expects (based on its jobstream definition calculations) a certain job to run and, for reasons that AAI cannot determine, the job run does not happen.
You should investigate no-run jobs to find out why they did not run and whether you need to revise the job definitions or take other steps to resolve the problem.
The Panes Menu on the Gantt Chart
The Gantt page have several panes with additional information about the jobstream run and its jobs. By default, these are all closed. Use the Panes menu to toggle them open and closed. The following are the panes you can show or hide from the Panes menu:
-
Machine Usage: When this enabled, it means that there is information that the scheduler has provided about the machines that this jobstream run has run on. In this case, select the option to open the Machine Usage pane in the Gantt chart, immediately below the timeline. For more information, see Viewing Jobstream Machine Usage on the Gantt View.
-
Virtual Resource Usage: When this enabled, it means that there is information that the scheduler has provided about the virtual resources that this jobstream run has run on. In this case, select the option to open the Virtual Resource Usage pane in the Gantt chart, below the timeline. If Machine Usage is also open, the Virtual Resource Usage appears below it. For more information, see Viewing Jobstream Virtual Resource Usage on the Gantt View.
-
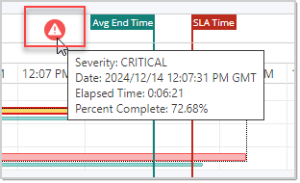
Alerts: Select this to see a narrow horizontal Alerts pane right above the main page of the Gantt chart where the job runs are depicted. If any alerts that are defined for this jobstream were triggered during this run, you see badges for the alerts at the point in the timeline when the alert was triggered. The badge shape and icon shows the severity category of the alert. Mouse over the badge to get the alert details. For more information, see Defining Alerts for a Jobstream and Viewing the Jobstream Details - Alerts.
-
Show Jobs Table: Select this to open the Job table below the Gantt chart. In the filterable table you can see every job that ran in this jobstream run and get details about them in columns that you can sort and rearrange. For more information, see Understanding the Jobs Table on the Gantt Page.
-
Show Run Info: Select this to open a pane to the right of the Gantt chart with job details. For any job that you select on the Gantt chart of Jobstream Tree, you see details about the job in two tabs:
-
Runs Details: This tab contains details about the run of the selected job in this jobstream run, including run times, delay values, and other details.
-
Job Properties: This tab contains all the job properties that you find on the Basic Information tab of the job details.
You can also open the job details page for the job in a separate tab with one click from this pane. For more information, see Viewing Job Run Details and Properties in the Gantt View.
-
To close any of these open panes, open the Panes and deselect the pane type.
The More Menu on the Gantt Chart
The More menu on the Gantt chart contains actions to get help and to export and share the Gantt chart. the following are the More menu options.
-
View Legend: Select this to open a pop-up with a key to the meaning of the various icons and lines that can appear on this view. This includes the icons next to the jobs in the Jobstream Tree as well as the lines and symbols that you might see on the Gantt timeline.
-
Export Data: Select this to download a CSV file with the contents of the Jobs table (which appears in the lower pane of the screen when it is showing) as it is currently configured in this view. For more information, see Exporting Table Data.
Exporting the Jobs table gives you a snapshot at a specific time of the job execution details for the jobstream run. Use this to save or share pinpointed states of a jobstream execution. This can be helpful in jobstream performance assessments and triage efforts, especially when you need to share details of execution behavior with others to solve issues.
-
Copy URL: Select this to get the URL for the Gantt chart page of this jobstream run so that you can share it with stakeholders or members of your team who have access to your AAI instance and have rights to view the jobstream.
When someone opens the URL, they have full access to the Gantt view of this run. They can navigate through the jobstream run and use any of the menu options to change view options and open and close panes as they wish. For a running or forecasted jobstream run, they can see and follow the real-time activities and status of the jobstream.
See also: