Understanding Simulation Results
When you run a simulation with proposed job definition changes, the AAI simulation engine predicts the execution behavior and effects, and presents the results as both a summary and with details of the potentially affected jobstreams. Furthermore, you can see the simulated runs on jobstream run details views and the Gantt view right next to the real jobstream runs without simulation changes. Use this topic to guide your understanding of the information about simulation results on the simulation pages as well as throughout AAI.
You see simulations results after you create and run a simulation. For information, see Creating and Running a Simulation. Until you clear the most recent simulation results, they remain on the Simulation pages, even when you leave the pages and return.
You can see the following kinds of simulation results in the following places:
-
On the Simulation summary page, you see a summary of the simulation predictions in relation to the job history data
-
On the Simulation details page, you see a list of the jobstreams that the job affects and the kind of impact the simulated changes would have on those jobstreams and you can select jobstreams to see the specific predicted affect on the jobstream
-
On jobstream pages, where you can filter to view simulated runs on the same page or view next to the actual runs.
-
On Jobstream Runs - Grid view, you cab see simulated runs of all affected jobstreams on the same list as the actual runs for the same jobstreams.
-
On Jobstream Run Details views, you see simulated runs next to actual runs of various states.
-
On the Gantt timeline view, you see how the simulated jobs fit into the jobstream run and view their impact on the entire run in relation to the other jobs in the process.
-
This page includes the following:
General Tips About Simulation Results
Light purple is the color that represents simulation runs on AAI pages and views. When you see simulation runs on the Jobstream Runs - Grid view, one of the Jobstream Run Details views, or the jobs on a Gantt timeline view, the simulated runs appear shaded in light purple.
Simulated predictions are calculated based on job and jobstream history over the previous 30 days.
The Results Summary for a Simulation
After you run a simulation, the first page of predicted results contains a summary of the simulation results.
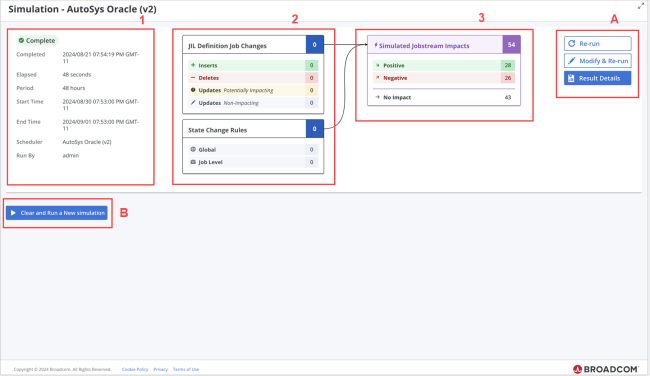
The results summary page for a simulation shows information about the settings that the simulation run is based on and the overall results of the simulation, as well as providing buttons for further actions. You find these on grouped on the page as follows:
-
The overall run statistics in side-by-side blocks of information, including the following:
-
The run state for the simulation to indicate whether the run has Completed or it is still Running.
-
Completed: The time the simulated runs completed
-
Elapsed:How long the simulated run took
-
Period: The period of time that the simulation covered
-
Start Time and End Time: The time that the first projected simulated run started and the time that the last projected simulated run ended
-
Scheduler: The name of the scheduler on which the proposed job changes were simulated.
-
Run By: The user name of the user that ran the simulation.
-
-
A summary based on the simulation settings that were defined for the current simulation, including the following:
-
JIL Definition Job Changes: A box that summarizes the job changes in the JIL code that the simulation is based on. This includes the following:
-
Inserts and Deletes: The total number of changes made with Insert and Deleted commands respectively.
-
The total number of Updates that the simulated changes resulted in over the various jobstreams that were affected.
These are broken down into two kinds of updates: Those that are projected to possibly affect jobstream run times (Potentially Impacting) and those that are not projected to affect jobstrreams runs times (Non-Impacting)
-
-
State Change Rules: This box contains the total number of state change rules that you entered for the simulation, summarized by category:
-
Global state change rules
-
Job Level sate change rules.
-
For more information, see Creating and Running a Simulation.
-
-
Simulated Jobstream Impacts: A box with the total number of jobstream runs that are projected to be affected by the changes proposed for the simulation, both positively and negatively. Below the header, this box provides the breakdown of number of jobstream runs based on the kind of impact the simulations would have on them.
-
Positive shows the number of jobstream runs that would have shorter run times because of the proposed job changes.
-
Negative shows the number of jobstream runs that would have longer run times because of the proposed job changes.
-
No Impact shows the number of jobstream runs whose run times would not change because of the proposed job changes. This amount is not included in the total in the box header.
-
You also have buttons for various actions that you can take from this page. These are arranged in two places on the page:
-
To the right of the right of the summary information, you fin d three buttons for actions that you can take to further work with the current simulation:
-
Re-run: Use this to run current simulation again, using the same JIL file and State Change Rules.
-
Modify & Re-run: Use this to go back to the page where you defined the current simulation and change the JIL code or the State Change Rules or both, and then re-run the simulation with those changes.
-
Result Details: Click this button to open the Details view of the current simulation, where you can see the results of the simulation by individual jobstream runs. For information, see The Results Details for a Simulation.
-
-
Under the summary information is the Clear and Run a New simulation button. Use this to go back to an empty Simulations page and define a new simulation with new settings. For information, see Creating and Running a Simulation.
The current simulation is deleted from the simulations pages and all jobstream run pages.
The Results Details for a Simulation
From the Simulation summary page, you can click the Results Details button to open the Simulation details page. Here you see the individual jobstreams that are projected to be affected by the job definition changes and state change rules that you proposed for the simulation when you created and ran it.
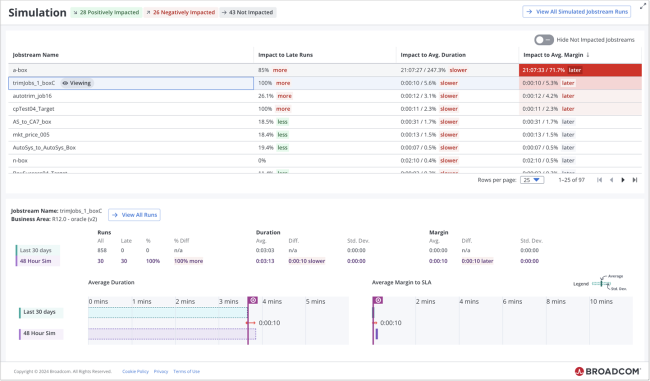
The Simulation results details page has three general areas, from top to bottom:
-
The title bar
-
The jobstream list
-
The details for the selected jobstream
Simulation Runs on the Jobstream Runs - Grid View
When you have an active simulation available in your instance, you can the simulated jobstream runs listed among the actual runs on the Jobstream Runs - Grid view. The rows for the simulated runs are highlighted in light purple.
There are two ways to see the simulated runs on this view:
-
Open the Jobstream Runs - Grid view and filter it for SIMULATED or also NEXT SIMULATED RUN. For information, see Monitoring Current Jobstream Runs on the Grid Page
-
Start at the Simulation details page, click the View All Simulated Runs button in the right of the title bar. The Jobstream Runs - Grid view opens and it is already filtered to show SIMULATED runs and for a time period that covers the simulated time period.
Click the Start Time for any of the simulated runs to open the Gantt timeline view of the run and see the job executions within the jobstream that changed due to the simulation.
Simulation Runs on Jobstream Run Details Views
When you have an active simulation available in your instance, you can also filter the jobstream Run Details views to include the simulated runs on the tables and graphics in all three views. This allows you to compare simulated runs to actual runs, side by side.
There are two ways to see the simulated runs on these views.
-
Open the Run Details tab of a jobstream that has simulation runs, and filter for SIMULATED or also NEXT SIMULATED RUN
-
Start at the Simulation details page, select the jobstream in the list, and then click the View All Runs button in the bottom half of the page. The Run Details tab for the jobstream opens and it is already filtered to show SIMULATED runs and for a time period that covers the simulated time period.
On all three views (Actual, Relative to SLA, and SLA Graph) the table rows for simulation runs are highlighted in a light purple and marked with a purple lightning bolt icon. On the graphic on the SLA Graph view, simulation runs are depicted as purple dots and the average line is likewise in purple. For information, see Three Views of Jobstream Run Details.
Simulation Runs on the Gantt Timeline View
When you have an active simulation available in your instance, you can view the Gantt timeline for simulated jobstream runs. On the Gannt timeline, you see the simulated run with all the jobs in their run sequence and with their execution bars in the timeline. The jobs with changed job definitions according to the JIL script that you provided in the simulation Settings and their run duration bars are depicted in light purple.
As you expand the container jobs, you see the changed jobs with their purple execution bars in context of the executions of the other jobs that did not change. This can help you see exactly how the changed job definition either shortens or lengthens the overall jobstream run time.
To open the Gantt timeline view of a simulated run, click the Start Time link for the simulated jobstream run (the row will be highlighted in light purple), on one of these pages:
-
The Jobstream Runs - Grid view. For information, see Monitoring Current Jobstream Runs on the Grid Page
-
Any of the views on the jobstream Run Details tab. For information, see Three Views of Jobstream Run Details.