Job Run History Graph Report
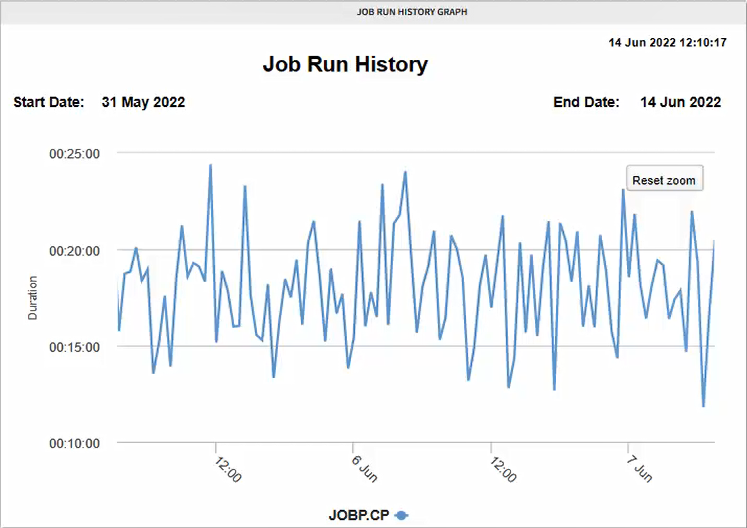
The Job Run History Graph report is similar to the Job End Time Graph report but instead or reporting on end times, it focuses on the runtimes of a job over time. The screenshot below shows a job with execution times that go from 13 minutes to almost 25. Each point in the graph is an execution. Click a point to display the Job Runs History Table for that particular execution. The table shows the history of executions for a specific time period.
Configuring the Report
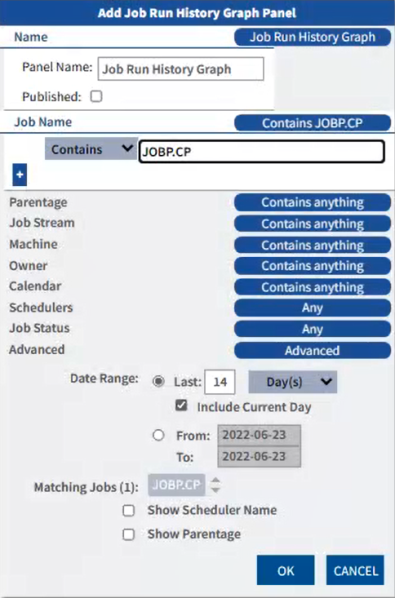
You can configure this report to provide data for one or for more jobs. You should specify a data range of at least 30 days to get a meaningful set of data. The rest of the configuration options is self-explanatory.
Working with the Report
Click the icon on the top right corner of the panel to open a menu with the configuration options:
-
Edit
Opens the configuration dialog, where you can edit the name, published status and filter criteria used in the report. For each data source you can add as many criteria as you need to narrow down the scope of the report. These criteria are combined using the OR operator.
-
Copy
Creates a copy of the panel that you can then configure and adapt to your needs.
-
Move
Moves the panel to a different page (dashboard).
-
Delete
Deletes the panel.
-
Shorter/Taller
Resizes the panel vertically.
-
Download
Downloads the report and you can choose between multiple formats: PDF, XLSX, XLS, RTF, CSV, ODT, ODS, DOCX, PPTX
-
Get Link
Creates a link to the report that you can share with other users.
See also: