Web UI Reports
AAI's Web UI reporting capabilities are flexible tools to report on virtually anything that happens in AAI and on the integrated schedulers: Jobs, jobstreams, runtimes, end times, SLAs, trends, evolutions over time and much more.
First, you create a dashboard, which is basically a web page. Then you add panels to that page. Each panel is a report that you can configure to provide the data that you need. You can schedule reports, duplicate them and then adapt them to your needs, download them, share them with other users through a link, and so forth.
This topic explains how to configure dashboards and panels and it describes how to work with them.
This page includes the following:
Prerequisites
For the AAI Web UI reports to be available, the following must be true:
-
The AAI administrator has installed a specific and dedicated web server and application alongside AAI.
-
You have received the ID and password to log in to the AAI Web UI.
Accessing the AAI Web UI Reports
The way you access these reports depends on your role and on the setup at your organization:
-
From within the thick client
In the menu bar select Tools > Launch Web UI.
-
Using the URL ID and password provided by your administrator
Either way you open the AAI Web UI for reports. This is what the Web UI landing page looks like:
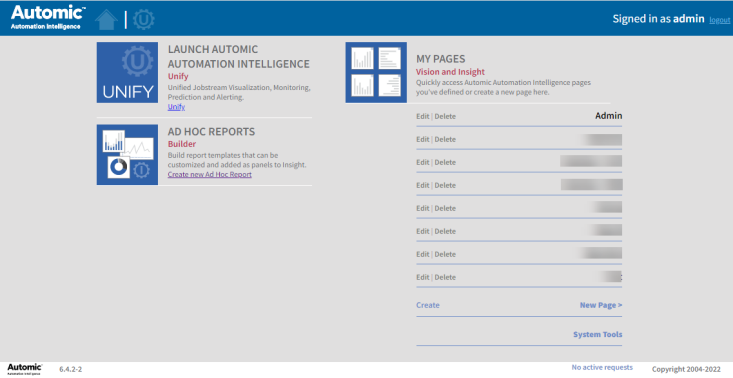
You find the Web UI reports in the MY PAGES section. It is also from this section that you start creating new pages (dashboards).
Creating Report Pages
This is how you create a page and add panels to personalize your reporting environment. The process is the same for Vision and Insight reports:
-
On the Web UI landing page click New Page and enter a descriptive name on the New Page dialog.
-
The SELECT PANEL TYPE is displayed, where you select the type of report that you want to create. The two tabs on this dialog let you choose between Vision and Insight:
-
Vision has 5 types of panels, they show real time data for job, jobstream status, forecast, system load and so forth.
-
Insight has 9 types of panels that use the AAI analytics and data management capabilities: Trends, graphs, batch reports, and so forth
The only two differences between Vision and Insight reports are the internal tool with which they are created and the toolbars that, in the case of Insight, provide some additional functionality to the panels. From a configuration or a usage perspective, it is irrelevant which one you use. You must only know where to find the report template that you need.
-
-
Select the type of panel that you want to add.
-
On the Add <type> Panel dialog do the following:
-
Enter a descriptive name for the panel. It should describe the type of data on which it will report.
-
Later, when you have finished configuring the panel, select Published if you want to make this panel public. This will give access to other users to this report. They will be able to add it to their dashboards, copy, download and share it, and so forth.
-
Configure the data source for this panel. You can keep the defaults or click on the buttons to personalize the result by clicking the Contains anything/Any buttons and entering the filter criteria. For each data source you can add as many criteria as needed. These criteria are combined using the OR operator.
-
-
Click OK to add the panel to your dashboard.
Vision Panels
The screenshot below shows a dashboard with four Vision panels (Trouble Job Streams, Job Dependency Graph, Active Job Streams, Completed Job Streams):
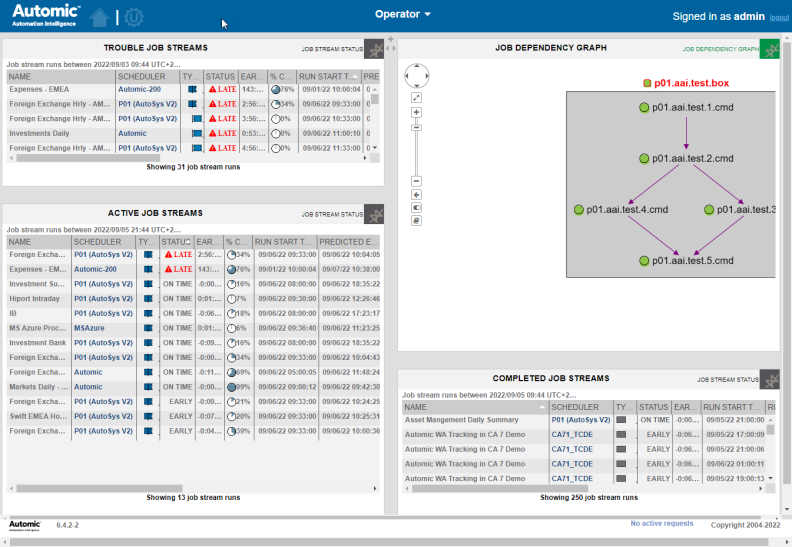
Use the plus symbol and the two little arrows on the upper right side of the panels to add a new one or to resize the current panel. To move a panel to a different position in the dashboard, you simply drag and drop it.
Each panel provides additional options that you can access by clicking its top right icon: Edit, Copy, Move, Delete, Shorter, Taller, Download, Get Link.
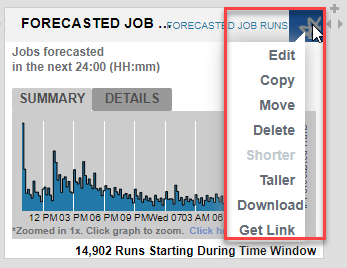
Most of these options are self-explanatory. With Get Link you create a link that you can share with other users so that they can access it.
Insight Panels
Insight panels have a toolbar at the bottom that lets you do the following:
-
Refresh the panel data
-
Download the report, you can choose between multiple formats: PDF, XLSX, XLS, RTF, CSV, ODT, ODS, DOCX, PPTX.
-
Schedule the generation and emailing of the documents
-
Report Types
The following report (panel) types are available:
Vision
Insight
In addition, you can build new report templates or enhance existing ones using Jaspersoft, a third-party product.