Trending Jobs Data Table Report
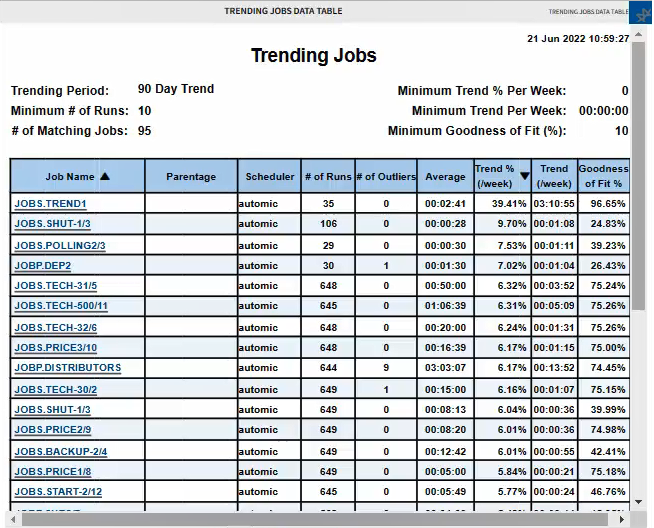
The purpose of the Trending Jobs Data Table report is to identify the jobs with execution runtimes that are trending up. This report retrieves the data from the scheduler. It includes all the executions in the scheduler to be able to isolate the problematic jobs. AAI scans the entire scheduler's workload history to calculate the data that populates this table.
Setting high filter criteria values renders a list of jobs with high and increasing runtimes.
This screenshot is an example of a Trending Job Data Table report. Both the jobs with the higher value in Goodness of Fit and the outliers are candidates for a design improvement.
Configuring the Report
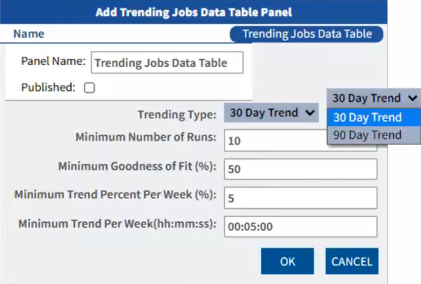
Since this report pulls the entire data set from the scheduler, there is no job filter. You configure the report by defining the trending criteria that you want to use to identify the jobs that you want to analyze further: The trending period (30 or 90 days by default, although your administrator can configure it differently), minimum number of runs, minimum goodness of fit, minimum trend per week (percentage and time).
Working with the Report
Click the icon on the top right corner of the panel to open a menu with the configuration options:
-
Edit
Opens the configuration dialog, where you can edit the name, published status and filter criteria used in the report. For each data source you can add as many criteria as you need to narrow down the scope of the report. These criteria are combined using the OR operator.
-
Copy
Creates a copy of the panel that you can then configure and adapt to your needs.
-
Move
Moves the panel to a different page (dashboard).
-
Delete
Deletes the panel.
-
Shorter/Taller
Resizes the panel vertically.
-
Download
Downloads the report and you can choose between multiple formats: PDF, XLSX, XLS, RTF, CSV, ODT, ODS, DOCX, PPTX
-
Get Link
Creates a link to the report that you can share with other users.
See also: