Using the Gantt Chart View
The real-time Gantt chart view is a powerful graphical tool that helps you monitor jobstream runs. From the chart you can drill down into all the details that pertain to both the jobstream and its jobs.
This page includes the following:
Accessing the Gantt Chart View
There are various ways to access the Gantt chart view:
Monitoring Tab
Select a jobstream, either on the left navigation pane of on the graphic view, and do one of the following:
-
Right-click and select Show Gantt view.
-
Click the Real-time chart view tool button on the toolbar.
-
Right-click an alert on the bottom left pane and select Gantt Chart View.
Analysis Tab
Select a jobstream, either on the left navigation pane of on the graphic view, and do one of the following:
-
Right-click and select Show Gantt view.
-
Click the Real-time chart view tool button on the toolbar.
Dashboards Tab
Click the Last Forecasted Run link
Gantt Chart Controls
The same controls are available in the Gantt Chart view as in the graphical view of jobstreams on the Analysis Tab. The Gantt Chart view is an independent window that can be minimized and maximized. It also contains a menu bar with a window menu item that allows the user to switch between open windows within. For more information, see Working in the Analysis Tab.
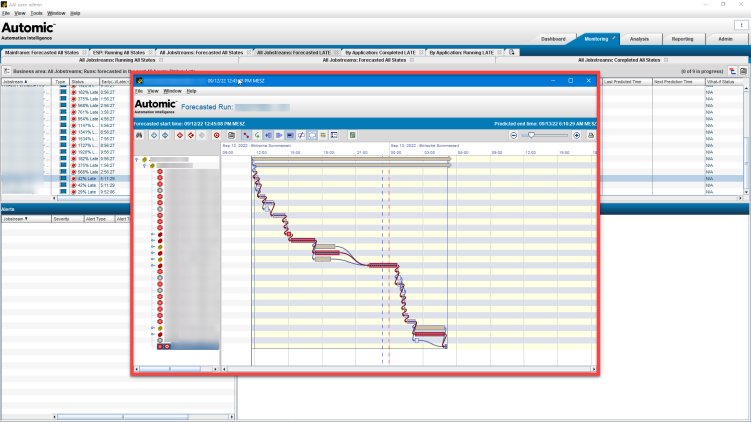
Gantt Chart Components
The real-time Gantt Chart View indicates clearly current time, the actual statistics of both the completed jobs in the jobstream, the currently running jobs, as well as the predicted statistics of both jobs that have not completed and jobs that are scheduled to run in the jobstream.
-
The target job is listed in the Jobstreams panel on the left side of the window. It is flagged with a bullseye icon.
-
The current time for a running jobstream is indicated by a solid gray vertical bar.
-
The average run time for the jobstream is represented by a dashed vertical line that is a blue in color. The Late Time is a dashed vertical line that is red in color.
When a jobstream completes and rolls off from the Monitoring Tab to the Analysis (historical) Tab, alerts associated with that jobstream run will no longer be displayed.
Gantt Chart Pop-Up Menu
Right-click the Real-time Gantt Chart to open a pop-up menu with options to navigate within the jobstream panel in the same way that you can navigate in the jobstream analysis panel on the Analysis Tab.
Job Details in the Real-Time Gantt Chart View
To access the job details, do the following:
-
Right-click on either the Gantt Chart depiction of a job or on the jobstream panel to the left.
-
Select the Job Details menu option.
The job details are the same as those displayed on the Analysis tab. However, if the selected job has not yet completed, its end time indicates that it is predicted.
Example: 11/30/05 3:11:19 PM MST (predicted).
Similarly, if the selected job has not yet started, its Run Start indicates that it is predicted.
(AutoSys)
Real-time Gantt Chart View with Job On Ice (AutoSys):If a job or box is On Ice, it will be displayed with an ice cube icon on top of it.
Real-time Gantt Chart View with Job On Hold (AutoSys): If a job or box is On Hold, it will be displayed with a hand icon on top of it.
For more information, see
See also: