Jobstream Summary Report
The purpose of the Jobstream Summary Report is to provide aggregated data on jobstream runs that shows the performance of your jobstreams relative to their SLAs. As you can infer from its name, this report is a summary. Ideally, you should configure it to use a big amount of data to provide a high-level overview of how your jobstreams are performing. This report also pinpoints the jobstreams that have delays.
You configure the Jobstream Summary Report to provide data on the following:
-
One or more jobstreams or business areas
-
A reporting period
Recommendation:
You can configure this report to present the results either in tables or in charts, depending on how you group the data. To generate charts, you must group the data by jobstream.
-
Due to the nature of this report, it makes sense to use large data samples. To produce meaningful data we recommend that you select at least one business area and 30 days.
-
If you have not already done so, read the following before continuing with this topic:
-
This topic explains AAI's reporting strategy.
-
This topic introduces you to the client reports and describes feature that are common to all report types,
-
Configuring the Jobstream Summary Report
Configuring this report is really straightforward. The following steps are common to all report types:
-
In the Reporting tab select a template from the Report Types pane and click the icon with the plus symbol. The <report type> New Report Criteria dialog is displayed.
-
Give the report a descriptive, self-explanatory name.
Tip:The reports that you create will potentially be available for other users in your organization. Define consistent and easy-to-understand naming conventions that let users easily recognize the content of the reports.
-
Select one of the following:
-
Public
Other AAI users can access this report, they can run it and they can make their own copy of this report. However, your user ID is still the owner of the report and nobody can modify your copy.
-
Private
Nobody can access this report but you. It makes sense to select this as long as you are working on configuring the client and you do not want to make it public yet.
-
General Tab
Here you determine the jobstreams or business areas for which you want to generate the report. By default, all the business areas in your client are selected. Use the Add and Remove buttons to select the jobstreams or business areas that you want to include.
Finding the Jobstreams/Business Areas you Need
The Available pane shows all the business areas and jobstreams in your client, which can potentially be thousands of them. Use the Categorized, Alphabetic and Matching options at the bottom of this pane to organize this data so that you can easily find what you need:
-
Categorized
The jobstreams are organized by business areas in a tree view.
-
Alphabetic
The jobstreams are displayed alphabetically without indicating their business area.
-
Matching
This search is useful if this pane contains many jobstreams. It provides various search options. It lets you search for jobstreams using regular expressions. It is a powerful tool to find matching patterns that you can select in bulk and move to the Selected pane
Grouping and Sorting
By default, the results are grouped by date and sorted by jobstream. This means that the report generates a table that shows the jobstream runs by day and where the jobstreams are sorted alphabetically.
To show how jobstreams perform over time, select Group By: Jobstream. This option also enables the Chart Selected Runs feature. Activate it if you want the report to provide a chart of the runs.
The Sort By dropdown list provides many useful options to sort the resulting data by. This comes in handy when you are looking for something specific.
Runs Tab
Here you select the status of the jobstreams for which you want to generate the report.
Completed
The report analyzes completed jobstream executions. You must select the period of time you want to report on. We recommend that you set a minimum of 30 days worth of data.
For completed executions you must select the time range or the specific dates for which you want to run the report. By default, it is set to the last 7 days. If you activate Include Current Day and enter 0 in Last <x> days, the report will contain data on the current day, midnight to current time.
In Progress
The report analyzes jobstreams that are running at the time of report creation.
Forecasted
The report analyzes jobstream runs that are forecasted to start in the future.
In the Status section you can drill down into more specific jobstream statuses.
Columns
By default all columns are selected, which means that all fields will be considered in the report. You can remove the columns that you do not want to show. Also, use the up and down arrows to modify the order of the columns in the report.
If you are reporting on SLA compliance, group the results by jobstream and sort them by Early(-)/Late(+). This way you can immediately see the jobstreams that have delays related to their SLAs.
Format Options
You can produce the report in multiple formats: PDF, HTML, XML and CSV. On this tab you specify the formatting options.
You can also generate the report in any specific time zone, which is particularly useful for teams that are distributed in different time zones. When you run the report, the dates will change and adapt to the selected time zone.
Example
Double click a report or select it and click the Run report in the toolbar. A message saying Run report is displayed over the AAI main tabs that lets you know that the report is still generating. When finished, the report opens in your browser.
This is what a Jobstream Summary report could look like:
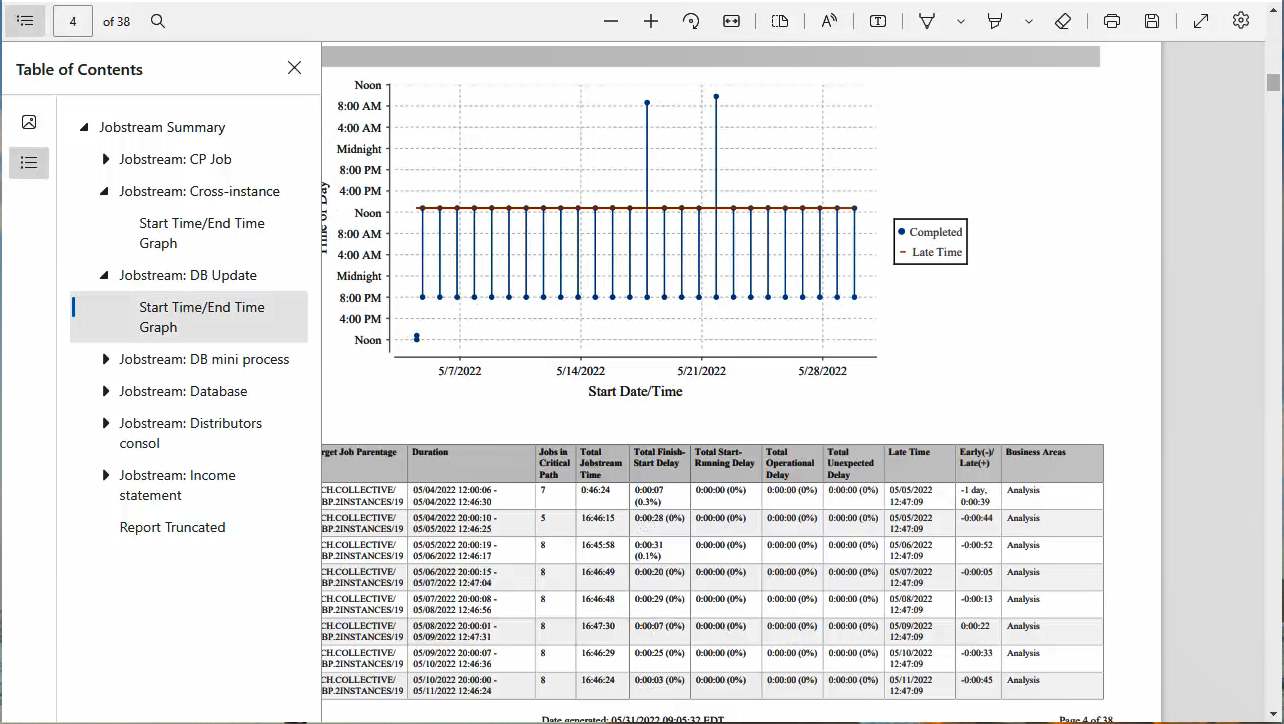
This report shows the jobstream performance in multiple business areas. The Table of Contents displays the business areas and jobstreams in a tree view. The main page shows the report for the selected jobstream.
The SLA that is set for this jobstream is marked by the red line. The vertical lines represent runs for each day. In this visual representation you can see very quickly the jobstreams that have a delay.
The table below the graph provides the details of the runs per day. In this report, the Early (-)/Late (+) column shows whether a particular run was late; a positive number in this column indicates that the jobstream has run over past the SLA.
See also: